


( Statistical Analysis, Summary Statistics & Scientific Report )
WML Neetling PhD, F.A.C.A. & AM Kachelhoffer, Mmed
This study was organized by the University of the Orange Free State in Bloemfontein, South Africa, Jan – April, 1998. Dr. Neetling is a professor of Biochemistry in the Faculty of Health Science at the University and Dr.Kachelhoffer is a professor of Medicine in the Faculty of Health Science.
A. Introduction
The Alcat Test is a relatively new blood test, developed as a screening test for adverse reactions to specific foods, food additives, pharmacoactive agents or environmental chemicals and food colorants.
This procedure utilizes electronic hematology instrumentation for cell counting and sizing combined with computerized data analysis to detect effects of pure food extracts with aliquots of whole blood. Citrated blood is diluted 1:5 with buffer and 500 ? l added to each encapsulated food extract in Coulter-type cuvettes.
This solution is buffered as a physiological fluid to pH 7.4 with sodium bicarbonate. The nylon discs contain dialyzed and freeze-dried skin test extract of foods taken from a solution of 50% Glycerol and 50% water with a 1 in 10 dilution of the antigens following 45 minutes incubation at 37 degrees Celsius with constant agitation. The cuvettes are incubated for a further 45 minutes at room temperature. Red cells are lysed by adding 16 milliliter Isotone ll containing 0.5% Alcalyse to each cuvette. Each sample is then analyzed in sequence in a modified cell counter and sizer with one control for every 10 food tests. A battery of 100 foods is used.
The Alcat Test is based on the accurate measurement of cells volume and counting of the remaining cells. Cell counting is done by counting pulses produced by changes in electrical resistance as the blood cells are suspended in a conductive liquid transverse a small aperture. Data are fed to a computer which compares each reaction mixture with an unreacted control aliquot and prints a graph of each superimposed on the control graph.
Scoring system:
Particles or cell pulses are counted and discriminated by size comparators to produce a histogram. The histogram is displayed by plotting the relative number of counts on the Y-axis. The cell size (in femtoliters) is displayed by plotting on the X-axis. Relative number (frequency) will refer to the number of cells of a particular size. The relative number is depicted by the height of a peak or the depth of a valley between two peaks.
The average range breakdown is as follows:
Range NEG : reaction scores below 9.5
Range 1+ : reaction scores between 9.51 and 13.5
Range 2+ : reaction scores between 13.5 and 19.5
Range MPOS : reaction scores above 19.5
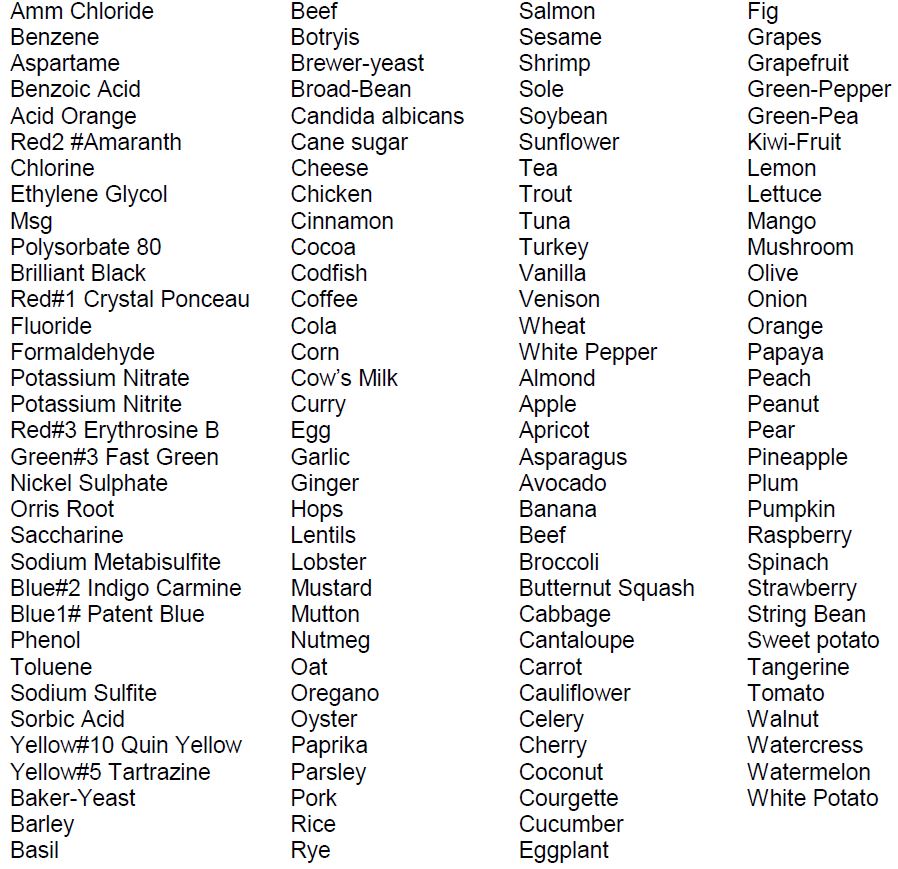
B. Antigens Spectrum
C. Study Design and Protocol
Aim of Study:
The aim of this study was to determine the reproducibility of all antigens, supplied by the manufacturer in 10 unknown consecutive patients, who were referred by a qualified, general practitioner or physician.
Patient profile:
Ten adult patients (male or female), two with no history of allergy and eight with one of the following conditions were included in the profile:
(I) Migraine
(ii) Gastro Esophycal Reflux
(iii) Irritable Bowel syndrome
(iv) Recurrent Sinusitis
(v) Allergic Rhinitis
(vi) Asthma
(vii) Eczema
(viii) Tension Fatigue Syndrome
Exclusion criteria
1. Patients on antihistamines
2. Patients on anti depressants
3. Patients on Corticosteroids
4. Patients on Anticoagulants
5. Patients with leukaemia / neutropenia / lymphositopenia
Consent
This study was conducted in full accordance with the principles of the “Declaration of Helsinki” and subsequent amendments. All patients gave their written informed consent according to the Ethics Committee of the Faculty of Health Science, University of the Orange Free State, Bloemfontein, South Africa. The protocol was submitted to the mentioned Ethics Committee and was unconditionally approved.
Methods
A total of 20 ml of blood was withdrawn from each patient via venous puncture under controlled, sterile conditions by an autonomous physician. Each aliquot was divided into 4 equal volumes of 5 ml of blood sample. All results were expressed in terms of a percentage which represented the reaction of the leucocytes with the specific antigens.
Data management
Patient data was gathered anonymously and number alphabetically A to l. Graphic and numeric data were presented for statistical analysis and scientific interpretation. Each graphic presentation was inspected by qualified staff of SensoLab to determine inaccurate reaction responses during measurement. Inaccurate measurements, according to graphic display, were eliminated and not presented for statistical analysis.
Statistical Data Analysis
A One Sample Analysis procedure, provided by Statgraphics Version 7.0 (Statistical Graphic Corp, Cambridge, MA, USA) was applied to determine four sets of calculations on the data:
(i) Sample Statistics
– Number of observations
– Average
– Standard deviation
– Median
(ii) Confidence Interval for the mean
(ii) Confidence Interval for the variance
(iv) Hypothesis Test (t-test) for the Population Mean
The system calculates confidence intervals for the mean and variance using t and chi-square distributions, respectively, and assumes that data come from a normal distribution. The percentage level for the confidence level was set to accommodate the specific interval provided by the manufacturer in which the first measurement, expressed as a percentage, occurred.
Results
All results are attached in the adjoining appendices in full printouts of the statistical procedures performed.
A full summary is enclosed in the adjoining appendices of the statistics of the entire study. The reproducibility of each antigen is summarized in that enclosure.
Summary Statistics
Number of patients evaluated = 10
Number of antigens investigated = 130
Number of data points investigated = 4989
Number of analysis performed = 1300
D. Statistical Report and Conclusion Remarks
The aim of this was to produce a statistical interpretation of the results and to make scientific conclusion based on the findings at completion of the study.
The number of patients included in this study gave an indication of the variance which occurs in the auto-immune system of 10 different adult individuals when exposed to 130 different antigens.
The Alcat Test covers a large number of antigens which are present in daily food substance and human exposure.
A total of 4.0576% of all measurements were detected as inaccurate for statistical analysis. This figure is well with statistical norms and could be regarded as normal for biological systems.
The overall reproducibility of Alcat Test system adds up to 92.0678% which makes the System acceptable as a screening model for testing allergy reactions in humans.
Certain antigens (20 out of 130) responded sub-optimal within the patient profile. Factors such as the stability of the antigen panel, the effect of transportation from the USA or storage temperatures could contribute to this phenomenon.
Finally, results indicated that the Alcat Test is reliable and reproducible in a scientific point of view.
E. SOP’S Regarding Statistical Analysis in Present Study
1. Approval of an official Ethics Committee.
2. Written consent by patients included in the study.
3. Clinical supervision by qualified and registered medical staff.
4. No changing of official data gathered.
5. The use of an international statistical package.
6. Scientific processing and interpretation of data.
7. Checking (3x) of data processing by autonomous qualified scientists.
8. No staff, involved in data processing, allowed to be a member of the group who requested the study.
9. Final conclusion and findings to be regarded as the one and only result.