Gilbert R. Kaats (1), Dennis Pullin (2) and Larry K. Parker (3)
1 Health and Medical Research Foundations, San Antonio, Texas;
2 Baylor Sports Medicine Institute, Houston, Texas; and
3 Womens Total Health Care, Angelton, Texas.
Address correspondence to; Gilbert R. Katts, Ph.D., Director, Health and Medical Research Foundation, 4900 Broadway, San Antonio, Texas, 78209. The research was conducted at Columbia/HCA’s Medical Center Hospital’s Sports Medicine and Performance Center, 7400 Fannin, Houston, Texas. None of the investigators have financial interests or involvement in American Medical Testing Laboratories or in the marketing of the Alcat Test, the food sensitivity test used in this study.
Abstract
To examine the efficacy of providing dieters with information on food sensitivities and potential food allergies, 100 subjects completed a beginning and ending Alcat food sensitivity blood test, an underwater test (displacement method) for assessing body composition and a Disease Symptom Inventory (DSI) self-report at the beginning and end of a 4-week test period. After completion of initial test, subjects were randomly divided into either a control or experimental groups. Subjects in the control group were asked to pursue a weight loss program of their own choosing while subjects in the experimental group were provided with the results of their Alcat Test listing foods to which they were most and least likely to have a food sensitivity or allergic-like reaction. Subjects in the experimental group were also provided with dietary guidance on foods that could be substituted for those to which they were likely to have a food sensitivity. Analysis of the pre-study data revealed that there were no significant differences between the experimental and control group on any parameters of the test battery. However, as compared to the control group, the group following the Alcat Test plan lost significantly (p<.001) more scale weight, % body fat and fat weight; had greater improvements in body composition (p<.001) and had greater increases in fat- free mass (p<.001). When compared to the control group, the Alcat Test group reported improvements in all 20 items on the DSI, 18 of which were significant at the p=.06 to <.001 levels. It was conclude that, as compared to participants following a weight control plan of their own choosing, following the Alcat Test and diet plan resulted in highly significant improvements in body composition and self-reported disease symptoms.
Introduction
It is well documented that excess weight is a major risk factor for a wide range of chronic diseases and exacerbates hypertension, dyslipoproteinemia, osteoarthritis and other musculoskeletal problems (1). Obesity is associated with a twofold increase in total mortality and the incidence of sudden death unexplained by autopsy may be 40 times higher in the severely obese as compared to the general population. (2). The most recent data from the Nurses Health Study involving 115,159 women confirms this relationship between weight and mortality and takes it a step further reporting that the lowest mortality rates are observed in women 15 percent below the US average for women of a similar age (3). Thus, not only are obese women at greater risk, but so too are women of average or slightly above average weight when compared to their leaner peers. The adverse health outcomes of excess weight is placing an increasing burden on our health care system (4,5). Almost a decade ago these economic costs were estimated to be in excess of $539 billion a year (6) and the most recent estimates place the annual cost close to $70 billion (7). Alarmed by these increased costs the US Department of Health and Human Services targeted a reduction in excess body weight as a national health objective to be achieved by the Year 2000 (8).But overweight is a condition that is highly resistant to intervention (9) and it is doubtful that we are any closer to a solution today than we were decades ago. In fact, we appear to be moving away from, rather than toward, the national objectives according to data from the most recent National Health and Nutritional Examination Survey, NHANES III. 10 The survey found a striking increase in the prevalence of overweight in the United States in the past decade. Almost 33 percent of Americans are now overweight compared to 24 percent a decade ago- the largest 10 year increase since the study began 1960. After years of treating obesity and reviewing the literature on the treatment of obesity over the past 50 years, Dr. Charles Bennett, past editor of the Harvard Medical Letter has concluded: No intervention has been shown consistently to achieve true weight control……Although the precise reason for the high relapse rate is not known, the stunning uniformity of these findings, which now extend over nearly five decades, should give pause to anyone who proposes to treat, much less cure, obesity (11).
Part of the failure to successfully treat obesity is a long held, but mistaken, view of the causes of obesity. Obesity has been thought to be the result of psychological problems or personality shortcomings. Overeating has been thought to be symptomatic of underlying psychological difficulties, past traumatic experiences or simply a lack of willpower or self control. But in spite of this widely held view, there is virtually no research to support it. As Bennett points out, ” It is doubtful whether psychologically conditioned eating behaviour plays any part in causing obesity….Obesity is not an eating disorder” (11). After two decades of studying the relationship between brain chemistry and eating behaviour, Leibowitz has concluded “…. disturbances in eating behaviour area reflection of disturbances in brain chemistries. What we eat, when we eat it and how much we eat are driven by the type of brain chemistry one has…(12). There also is increasing evidence that the origin of these difficulties is genetic in nature. In his article on “Genetics of Obesity: an update on molecular markers,” Bouchard (13) suggests there is evidence for both single and multiple gene anomalies among the obese. The ob gene and its product the leptin protein have also been implicated in regulating long-term eating behaviour (14). Another protein, glucagon-like peptide 1 (GLP-1) has been found to be involved in the regulation of short tern eating behaviour (15). Blum (16) points out the long established relationship between compulsive eating disorders and drug and alcohol addiction is well documented and adds,
“Neurochemical studies show the pleasure –seeking behaviour is a common denominator of addiction to alcohol, drugs and carbohydrates.. all cause the release of dopamine in the primary reward area of the brain…..there is general agreement that they work through the dopaminergic pathways of the brain. Variants of the dopamine D2 receptor appear to be risk factors in obesity. The A1 allele was present in 45 percent of obese subjects as compared to 19 percent nonobese subjects…(17) when the subjects profile included factors such as parental obesity, a later onset of obesity and carbohydrate preference, the prevalence of the A1 allele rose to 85 percent. More recently another study found a significant association between genetic variants of the D2 receptor and obese subjects (18).”
In his recent book, Weigh Less, Live Longer (19), Aronne concurs with Blum’s suggestion of a genetic basis of obesity pointing out that genetic anomalies lead to a number of biochemical differences between the obese and nonobese. Aronne suggests that the hypothalamus in the obese may under-secrete serotonin, which curbs appetite, and over-secrete neuropeptide Y and galanin which stimulate the appetite. He also reports that the obese have more and larger fat cells than the nonobese and the obese continue to produce additional fat cells. According to Aronne, in overweight people, lipoprotein lipase, an enzyme that “draws” fat either to muscle or fat cells is out of balance causing more fat to be drawn to fat cells for storage instead of to muscle cells where it can be metabolised. The overweight are more likely to be insulin resistant and maintain higher levels of insulin with a resultant stimulation of appetite and a lowering of the amount of sugar that is burned as energy while increasing fat stores. The latter view is also consistent with Sears (20) view that high-carbohydrate, low-fat diets may be self-defeating for some people since increased carbohydrates intake produces increased blood glucose which increases secretion of insulin by the pancreas. In addition to the problem of insulin resistance, Sears also points out that the liver is more likely to store rather than metabolize fat when serum insulin is increased. This shift in thinking away from psychiatric/psychological explanations to genetic/biochemical explanations of obesity is summarised in The Harvard Heart Letter’s lead article entitled “Losing Weight: A New Attitude Emerges:“Although recent research has provided new insights into the health effects of obesity, the real news on this condition is the different way it is being viewed. Medical researchers and weight loss experts no longer regard being over-weight as a simple failure of willpower. Instead obesity is considered a chronic disease, like hypertension or diabetes. An expert panel of the American Heart Association has recently advocated a ‘a conceptual housecleaning’ in the way health-care providers and the general public think about this issue (19).”
This biochemical and genetic research is generally consistent with what many bariatricians and allergists have been suggesting for decades. In their view, overeating is an allergic-like response to certain foods which may trigger or activate biochemical and physiological functions that drive the obese to overeat and make it very difficult to stop eating once they start eating certain foods. For example, in 1980 McDowell, (20) in an article entitled, “Appetite Control: An Addiction-like Component in Overeating and Its Cure,” suggested:“…a biochemically-based addictive response to highly refined carbohydrates may be a major contributor to obesity. I propose that a biochemically based nonpsychogenic, addiction-like process is influencing the appetites of most, if not all obese persons; and further, that this component is a major factor in weight control problems of the majority of the overweight millions in modern industrialised societies. The concept that food addiction can lead to obesity is not new. However it has been given much too`little’ attention in medical circles. (21,22). Those irresistible cravings stemming from the cyclic processes of biochemical dependency can sabotage any weight control program. They may be temporarily suppressed during active weight control programs, but when the patient returns to his former eating habits, the addictive forces are reactivated and irrepressible eating returns. The majority of the millions of persons with typical, uncomplicated adult-onset obesity will be able to maintain a healthy weight with only reasonable dietary attention once these addictive cravings are extinguished…the allergist is needed to identify specific allergenic-addicting foods or other ‘binge’ inciting chemical excitants (20).”
A year earlier, Royal in an article entitled, “Food Allergy Addiction in a Bariatric Practice,” pointed out that:“…Bariatricians see a preponderance of food-addicted or ‘carboholic’ obese patients who usually turn to them for help when all else has failed. Before satisfactory treatment can be carried out, the addictant foods must be identified and the patient must be convinced of the seriousness of the problems (22).”
What this suggests is that compulsive overeating may be symptomatic of the patient’s allergic reaction to food. Thus, instead of the more commonly observed symptoms of food allergies, (e.g. rashes, hives, etc.), these bariatricians are suggesting the addictive overeating patterns could be symptomatic of food allergies, not the host of other explanations often given for overeating. But for this to become a reasonable treatment plan for the obese, a more exacting and simpler assessment of food allergies needs to be developed, As Fell et.al. (23) points out,
The Short Term Efficacy of the Alcat Test of Food Sensitivities to Facilitate Changes in Body Composition and Self-reported Disease Symptoms:
“If one accepts an hypothesis that food might be implicated, and this is being more generally recognised, then currently the only course of action is to establish such a link is an exacting programme of dietary elimination followed by selective food challenges based on experience or more usually guesswork. In either event the process of identification is laborious and difficult for the patient and clinician, often with poor compliance by both!”
To address his problem, these researchers evaluated American Medical Testing Laboratory’s Alcat Test as an alternative to the traditional approach to identifying food allergies. The Alcat Test uses a blood test to identify the potential for an allergic reaction to up to 100 foods (see description below). Fell et.al. found the Alcat Test to be promising alternative to selective food challenges, a view supported by other researchers (24-26) including Solomon (27) who evaluated the efficacy of the Alcat Test with 172 patients and concluded:
“The advantages of speed and scope of the Alcat Test system in testing foods, in terms of numbers of foods that can be tested at one time, more than compensates for the slight decrease in accuracy when compared to the standard of oral food challenge…Compared to standard IBS or standard migraine diets, the Alcat Testing is much superior because it is specific to the patient.”
Using patient self-reports of the effectiveness of the elimination diets and or allergy shots alleviating symptoms of obesity, Solomon reports 50 percent of the 33 cases she evaluated reported improvements in their obesity compared to 9 percent using immunotherapy. However, Solomon and other researchers evaluating the efficacy of the Alcat Test used scale weights, subjective self-reports by patients and their own clinical experiences in drawing their conclusions. No studies have been reported to date evaluating the efficacy of the Alcat Test evaluating the type of weight that was lost (body fat or non-fat mass) or comparisons with control groups who followed weight loss plans of their own choosing. One could advance the argument that much of the weight that was lost was merely fluid depletion rather than metabolising of stored fat. It was to examine these relationships in addition to replicating patient self-reports on the alleviation of disease symptoms that this research was directed.
Materials and Methods
Subjects
A total of 100 subjects were selected using the criteria described under “Procedure.” Table 1 provides comparisons of subject characteristics by gender and initial differences between the experimental and control groups. None of the differences between the two groups were statistically significant suggesting subjects on the two groups were virtually identical on these dimensions. Table 1. A comparison between females and males and experimental and control groups prior to following the Alcat Test diet plan or a plan of their own choosing for 30 days.
The Alcat food sensitivity test
The Alcat Test is based on changes that occur in white blood cells and platelets when whole blood is incubated with purified extracts, food additives, molds and other substances. The test uses a specially designed haematology analyser based on the impedance method of counting and sizing particles interfaced with a PC. Following incubation, any change in size and/or number of blood cells is recorded and reported. To obtain the measurement, citrated fresh blood is diluted with 1:5 buffer and 500 microliters added to each test vial containing either a test reagent and buffer or just buffer without reagent to serve as a control. The solution is buffered as a physiologic fluid to 7.4 pH with sodium bicarbonate. Following 30 to 40 minutes incubation at 37 degrees C. with constant agitation, the test vials are incubated for an additional 30 minutes at room temperature. Just prior to the analysis, the red cells are then lysed by adding 8 ml of Isoton 11 (Counter Electronics) containing 0.5 percent alkalyse TM (AMTL Corp.) to each vial. Usually between 100 to 150 individual foods and other substances are tested for each patient (28).
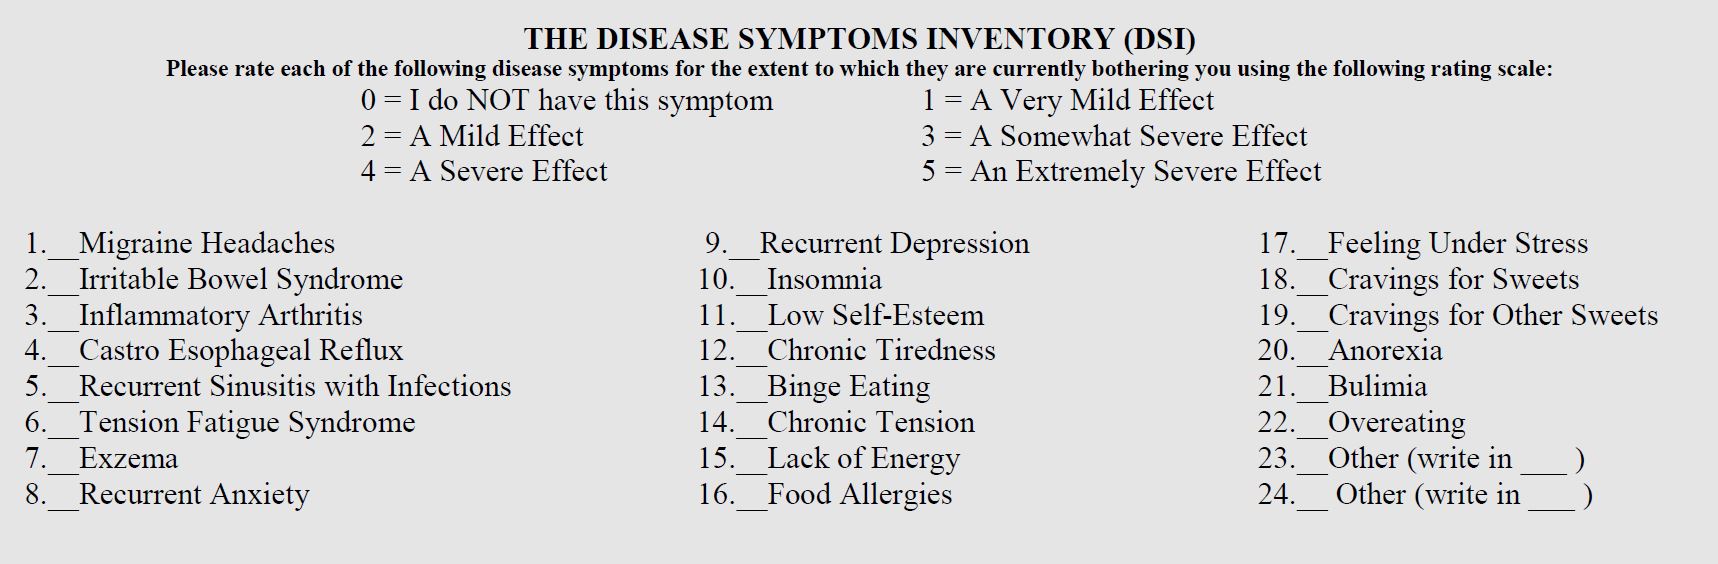
The Disease Symptom Inventory (DSI)
The DSI contains the 24 disease symptoms listed below (next page) and asks subjects to rate the extent to which each of these symptoms is currently bothering them.
Procedure
Subjects were selected from the first 100 people who responded to an article about the study appearing in a weekly newspaper, Houston City Fitness, Houston, Texas, (29) and who met the selection criteria below. Potential subjects completed the DSI and only subjects who reported that two or more of these symptoms were currently having a “somewhat severe effect” were selected for the study. Once subjects enrolled in the study and signed a standard informed consent, they completed an underwater test (displacement method) to determine body composition. Underwater tests were conducted by the principal (GRK) investigator using a Whitmore Volumeter which correlates highly with hydrostatic weighing and has a test-retest reliability between .96 and .99 (30). Subjects were assigned a number from 1 to 100 and using a random numbers generator, were assigned either to an experimental or control group. Those assigned to the experimental group, were given their Alcat Test results with the Alcat Test diet. Subjects in the control group were asked to pursue a weight loss program of their own choosing and would be provided with their Alcat Test results upon completion of their posttests. For each week for the next four weeks, subjects in both groups visited the Columbia Hospital System’s Sports Medicine and Wellness Institute in Medical Center Hospital, Houston, Texas to obtain a scale weight, complete a weekly DSI and report any difficulties they were having or side effects they were experiencing. At the end of the fourth week, all subjects completed a second body composition and DSI.
The Criterion Measure-Body Composition Improvement (BSI)
Since efficacy is best defined as fat loss while maintaining or increasing fat free mass (FFM), we calculated a BCI score for each subject reflecting positive or negative changes in body composition that occurred during the study. To calculate the BCI, losses in body fat and increases in FFM were added as positive changes and increases in body fat and decreases in FFM were added as negative changes. For example a subject losing 2 pounds of body fat and gaining 1 pound of FFm would receive a BCI of =3 while a subject losing 2 pounds of fat, but also losing two pounds of FFM would receive a BCI of 0. In a recent article (31) we discuss the clinical superiority of the BCI over scale weight, BMI and percent body fat.
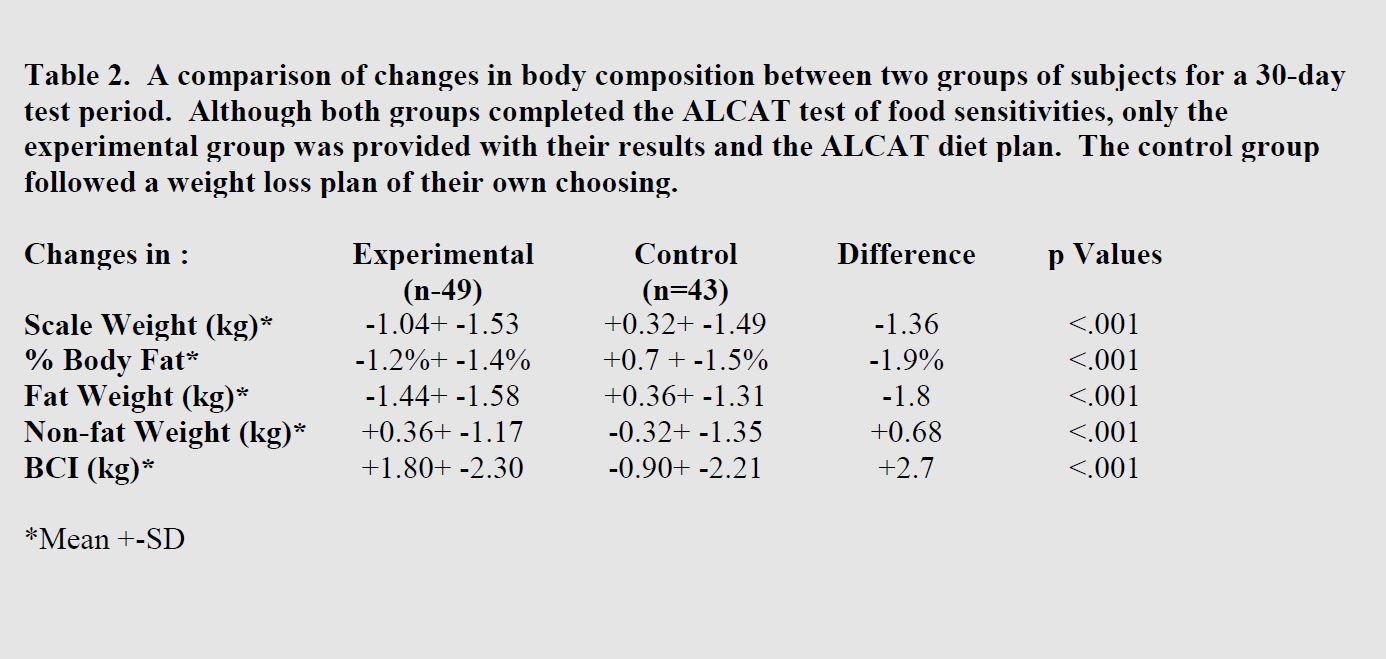
Results
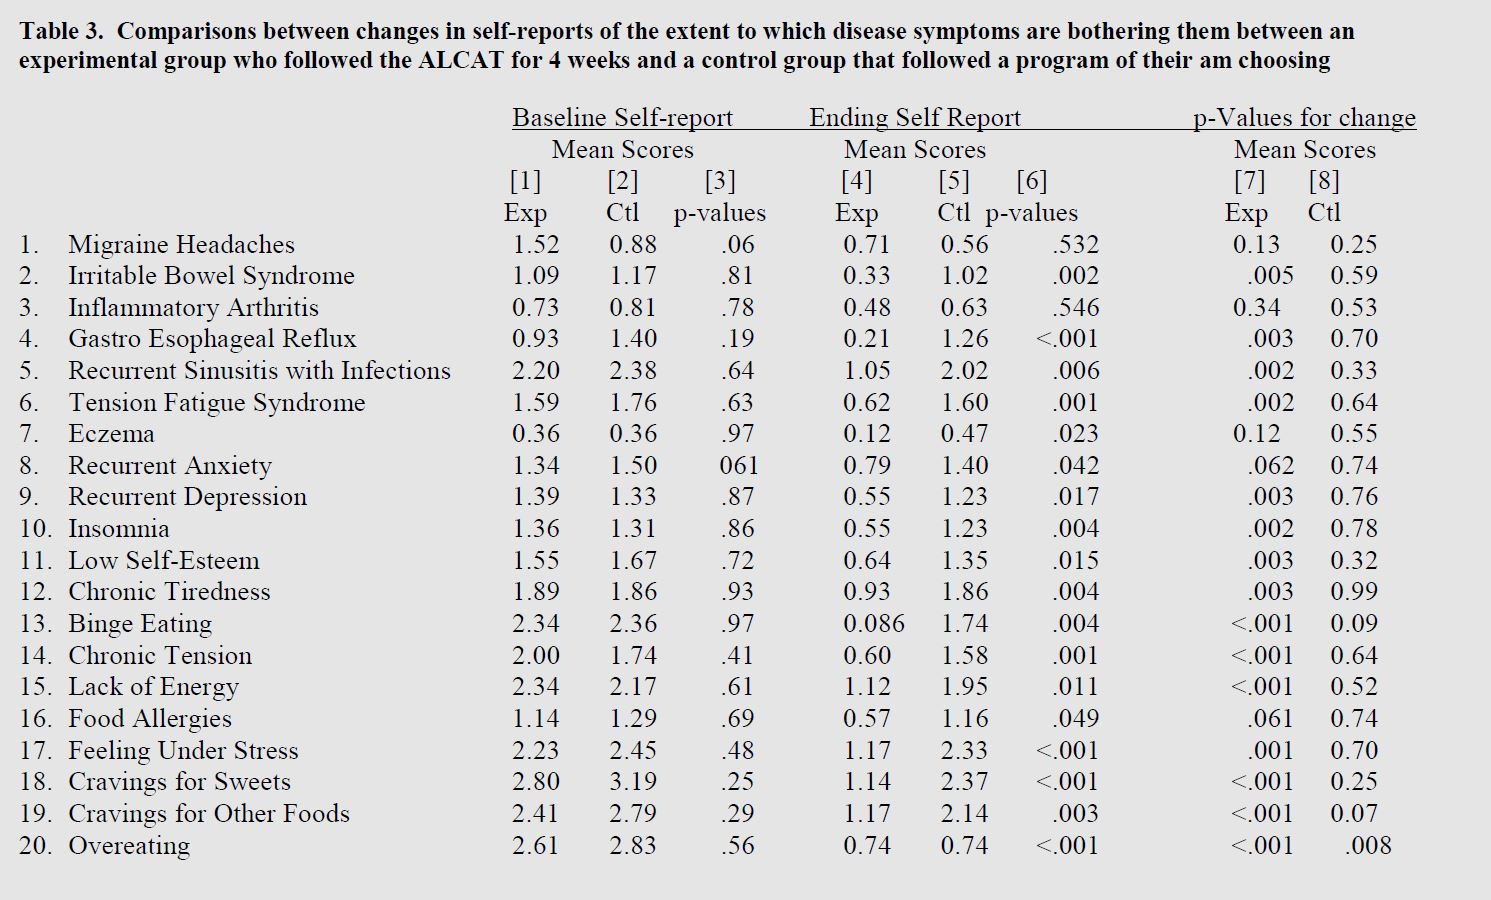
A total of eight subjects (8 percent), one from the experimental group and seven from the control group, either dropped out of the study or id not complete the final body composition test. There were no indications that these dropouts differed from those who completed the study on any of the body composition measures. Table 2 provides comparisons of the changes in body composition parameters that occurred between the experimental and control groups over the 4-week test period. The “p values” were calculated from the t-tests between the distribution of the amount of change that occurred during the study in the experimenting and control groups. BMI was not included since, as a measure of change. BMI is o different than scale weight since height remains constant and any chance in BMI will be attributable solely to changes in scale weight. Table 3 contains the p-values derived from Student t-tests between the ratings rendered by each group at the beginning of the study. Columns 4 and 5 contain the mean ratings rendered by each group at the conclusion of the 4-week test period. Column 6 contains the p-values derived from Student t-tests between the ratings rendered by each group at the end of the 4-week test period. Column 7 contains p-values for a comparison of the baseline and ending ratings rendered by the experimental group. Column 8 contains p-values for a comparison of the baseline and ending ratings rendered by the control group.
Discussion
Baseline Comparisons
A review of Table 1 reveals a striking similarity between the experimental group and the control group. There were no statistically significant differences between the groups on any of the five parameters of body composition that were studied. As the “p-values” indicate, the two groups were remarkably similar on these dimensions. A similar conclusion must be drawn from the data presented in Table 3. As indicated by column 3 of this table, there were no statistically significant differences on any of the 20 symptoms examined. Although the DSI contains “Anorexia” and “Bulimia”. So few people reported that these symptoms were bothering them they were dropped from the analyses. Thus, it appears the random assignment of subjects to either of the two groups was very effective in producing two groups that were almost perfectly identical.
Changes in Body Composition
The data in Table 2 provides a comparison of changes in body composition parameters that occurred in each group during 4-week test period. It is clear that no matter which of the five parameters that were measured, as compared to following a plan of their own choosing, participants who followed the Alcat Test plan achieved rather dramatic changes in their body composition. An examination of the distribution of changes for the experimental group also revealed that these changes were not result of several unusual subjects making dramatic changes that resulted in a significant change in mean values. In fact, using a non-parametric statistic such as Chi-Square indicates a highly significant difference between the distributions of the two groups. For example, 80 percent of the subjects in the experimental group lowered their body fat during the study compared to 34 percent in the control group. A nearly identical difference was found on the BCI where 78 percent of the experimental group achieved an improvement in their body composition compared to 29 percent in the control group. Even when one focuses only on the changes occurred in the experimental group without comparison to the control group, the data reveal that 98 percent of the subjects following the Alcat Test plan either lost scale weight or improved their body composition.
Changes in Disease Symptoms
As the data in Table 3 reveal, while there were no statistically significant differences between the experimental and control group on any of the 20 baseline scores (Col.3), the ending scores were almost the complete opposite, A total of 18 of the 20 scores on the ending self-reports were statistically different (p<.05) with the experimental group reporting significant improvements in all 18 disease symptoms. Columns 7 and *present p-values between the distribution of changes that occurred during the 4-week test period, As compared to the control group, the experimental group reported improvements in all symptoms, although only 18 reached the p=.05 or greater level of statistical significance. Conversely, in the control group, although a positive change was reported in 17 of the 20 symptoms, only one of these (Overeating) reached statistical significance (p<.008), although “Cravings for Other Foods” and “Binge Eating” approached significance (p<.07 and p=.09) suggesting that the control group did have some measure of success on the programs they chose. However, a comparison of the changes that occurred in the experimental group with the changes that occurred in the control group revealed that on all three dimensions, the experimental group achieved statistically significant greater change on these dimensions.An analysis of the week-by-week changes in each group suggests that many of the changes reported by the experimental group occurred during the first week of the following the plan and continued to improve through out the 4-week test period. Conversely, few changes occurred in the control group during any of the four weeks of the study nor was there any indications of a statistically trend in the positive direction.
Conclusion
These data provide compelling evidence for the short term efficacy of the Alcat Test and diet plan in producing a positive change in body composition and self-reported disease symptoms. No matter what parametric or nonparametric statistically was used, the differences between the improvement in all parameters of body composition (weight, lean weight, fat weight, percent body fat or body composition improvement (BCI)), was far greater in the group that followed the Alcat Test program than in a control group that chose their own program. The same conclusion must be drawn from comparison of baseline and post-study changes in 20 disease symptoms where the Alcat Test group achieved much greater improvement in these symptoms than did the control group.
Acknowledgements
This study was partially funded by a grand from the American Medical Testing Laboratories, Florida.
Literature
1. US Dept of Health and Human Services. The Surgeons General’s report on nutrition and health. Washington, DC: US Government Printing Office.[DHHS publication (PHS) 88-50210]
2. Sjostrom LV. Mortality of severely obese subjects. Am J Clin Nutr 1992; 55:5165-235.
3. Manson JE, Willett NC, Stampfer MJ, Colditz GA, Hunter DJ, Hankinson SE, Hennejens CH and Speizer FE. Body weight and mortality among women. N Engl J Med 1995; 333:677-85.
4. Pi-Sunyer PX. Health implications of obesity. Am J Clin Nutr 1991; 53:15955-16035.
5. Pi-Sunyer PX. Medical Hazards of obesity. Ann Intern Med 1993; I 19:655-660.
6. Colditz GA. Economic costs of obesity. Am J Clin Nutr 1992; 55:5035-5075.
7. Insitute of Medicine. Weighing the Options. Criteria for evaluating weight-management programs. Washington DC: National Academy Press 1995; (in press).
8. Public Health Service. Healthy ‘people 2000.’ National health promotion and disease prevention objectives. Washington DC: US Dept of Health and Human services; 1990.
9. NIH Technology Assessment Conference Panel. Methods for voluntary weight loss and control: technology assessment conference statement. Ann Intern Med 1993: 119:764-770
10. Kuczmarski RJ, Flegal KM, Campbell SM, Johnson CL, Increasing prevalence of overweight among US adults; The National Health and Nutritional Examinations Surveys, 1960 to 1991. JAMA 1994; 272:205-211.
11. Bennett WI. Obesity is not eating disorder. The Havard Mental Health Letter 1991; 8:4-6.
12. Leibowitz S. Neurochemical-neuroendocrine systems in the brain controlling macronutrient intake and metabolism. Trends Neurosci 1992: 15:491-497.
13. Bouchard. C. Genetics of obesity: an update on molecular markers. Intl J of Obesity 1995; 19 (Supp):S10-S13.
14. Zhang, X, Proenca R, Barone M, Leopold L, Freidman JM. Positional cloning of the mouse obese gene and its human homologue. Nature 1994; 372(6505):425-32.
15. Turton MD, O’Shea D, Gunn I, Beak SA, Edwards CMB, Meeran K, Choi SJ, Taylor GM, Heath MM, Lambert PD, Wilding JPH, Smith DM, Gahel MA, Herbert J, Bloom SR. A role for glucongon-like peptide-like peptide-1 in the central regulation of feeding. Nature 1996; 379:60-72.
16. Blum K, Cull JG, Braverman Er, Comings DE. Reward deficiency syndrome. Am Sci 1996; 84 No.2:132-145.
17. Noble EP, Noble RE, Richie T. D2 dopamine receptor gene and obesity. J Eating Disorders 1994; 15:205-217.
18. Comings DE, Flanagan SD, Dietz G, Muhleman D, Knell E, Gysin R. The dopamine D2 receptor (DRD2) as a major gene in obesity and height. Bio Med Met Biology 1993; 50:176-185.
19. Losing weight: a new attitude emerges. Havard Heart Letter 1994; 4 No.7:1.
20. McDowell M. Appetite control an addictive-like component in overeating ands its cure. Obesity Barit Med 1980; 9No.5:138-143.
21. Dickey LD. Clinical Ecology. 1976. Springfield IL, Charles C. Thomas.
22. Royal F. Food allergy-addiction in a bariatric practice. Obesity Bariat Med 1978; 7 No.2:56-58.
23. Fell PJ, Soulsby S, Brostoff J. Cellular responses to food in irritable bowel syndrome-an investigation of the ALCAT test. J Nutrit Med 1991; 2:143-149.
24. Hoj L. Food intolerance in patients with angioedema and chronic urticaria: an investigation by RAST and ALCAT test. Eur J Aller Clin Immun 1995; 50:Supp No 26.
25. Cabo-Soler JR. Comments on diets in esthetic medicine. Abstract of 14th Med Day of Esthetical Medicine & Dermatological Survey. Venice, Italy, Sep 22-23, 1995.
26.Hoj L. Diagnostic value of ALCAT test in intolerance to food additives compared with double blind placebo controlled (DBPC) oral challenges. J Alleg Clin Immun 1996:No 1, part 3.
27.Solomon Ba. The ALCAT test- a guide and barometer in the therapy of environmental and food sensitivities. Environ Med 1992; 9:54-59.
28.AMTL Technical Report No 2021. AMTL Corp, One Oakwood Blvd. #130, Hollywood, Florida.
29.Kaats GR, Pullin D. Are weight problems the result of allergic-like food sensitivities?A local study takes a look. City Fitness Magazine, Feb 1994.
30.Ward A, Pollack ML, Jackson AS, Ayres JJ, Page G. A comparison of body fat determined by underwater weighing and volume displacement. Am J Physiol 1978; 234(1):E94-E96.
31.Kaats Gr, Pullin D, Blum D, Blum K. The clinical superitiory of using a body composition improvement index as measure of change instead of scale weight, body mass index or %body data. Curr Ther 1996: (In press).