Purpose
The purpose of this study was to evaluate data generated by the ROBOCAT II (Alcat Test by Cell Science Systems), by comparison to another particle counter, the FACSCalibur (Becton-Dickinson), which in addition to particle size also measures 4 other parameters for each particle. The FACSCalibur multi-parameter analysis allows evaluation of cellular changes in different subsets based on size, and allows functional correlations to be made, such as changes in de-granulation, ROS production, cellular viability/death, and changes in expression levels of antigens on the cell surface.
Background
ROBOCAT II is a machine that tests food-related allergens via a whole blood culture that has been exposed to individual allergens coated in a microtiter plate. Results are analyzed by looking at the size dimensions of a particular cell that is currently being examined. Whether a cell is swelling, shrinking or becoming oddly shaped these configurations will correlate to a cellular state of stress. The physical changes lead the analyzer to interpret that the blood cells were reacting to a given allergen.
Performed Work
All testing of individual donors was carried out in parallel. Experimental samples were tested both by the ROBOCAT II and FACSCalibur to evaluate similarities of results as well as cells examined by CytoViva microscopy.
Logisitics
The ROBOCAT II machine has been installed at NIS Labs and allergy testing has commenced. Previously we have screened 4 individuals with the Alcat Test antigen panel that contains a total of 50 antigens. During the setup of the ROBOCAT II machine, initial antigen testing was performed on 1 individual and, in parallel, cells from this same individual were exposed to the Alcat Test antigen panel and analyzed by flow cytometry.
These initial experiments allowed us to identify some immediate questions that needed to be answered in order to move forward with our goal of processing identical samples on the 2 different machines without introducing any changes. The challenge comes from differences between how the 2 machines process samples.
Following incubation of blood with the antigen panel, the ROBOCAT II machine lyses red blood cells in samples one well at a time and immediately collects electrical impedence data after a 20-second lysis. Red blood cells are much more sensitive to lysis than white blood cells but it is necessary that data collection occur rapidly to prevent adverse effects on white blood cells with longer incubation in lysis reagent. The volume of lysis reagent used is 2.5 ml.
In order to analyze whole blood samples on the FACSCalibur flow cytometer, samples first needed to be transferred to a FACS tube following lysis and data collected. The amount of pressure applied to the sample may be higher in the FACSCalibur machine. This increased pressure could induce cellular changes in shape, size or reactivity and effectively alter the sample that is being analyzed when compared to the readout from the ROBOCAT II.
What we learned from initial exploratory work:
• Cells cannot stay in lysis buffer for very long without adverse effects. Once samples were on the FACSCalibur, ongoing and cumulative changes in cell characteristics were witnessed, starting after 10 seconds of data collection, and continued throughout the period of data acquisition.
• Diluting samples with 2.5 ml of lysis buffer reduces the number of events that can be collected on the FACSCalbur per second; however, a couple thousand events could be acquired in the first 10 seconds. If particle concentration was higher per microliter, data acquisition on the FACSCalibur could happen within 10 seconds.
• Processing of samples by FACSCalibur takes longer than sample processing by the ROBOCAT II. Blood samples to be analyzed by flow cytometry may have to be exposed to only part of the allergen panel at a time (i.e. perform a staggered start of reaction in the parallel plate to be assayed by FACSCalibur).
• Some agitation is necessary to ensure contact between cells and antigens in the test wells. However, the agitation initially used had a negative effect, setting off reactions in almost all wells, including the negative control wells. Reducing the intensity of agitation has helped to produce more consistent data.
Further exploration and analysis in this report:
Primary goal: To achieve parallel patterns of particle size distribution on both machines.
This was essential to achieve before proceeding with either validation of the allergy test or proceeding with new methods development on lymphocyte proliferation and nutritional status.
Note: The results presented in this report reflect further work based upon initial hands-on pilot work and continued communications between Alcat and NIS Labs, and feedback from Dr. Holger Fehr.
• Experiments were carried out on purified white blood cells. Whole blood from a normal donor was separated on a Histopaque gradient and plasma stored at 4oC. White blood cell fractions were processed through three phosphate buffered saline (PBS) washes and then reconstituted in 10% plasma in PBS. Purification of white blood cells avoided the need to lyse RBC prior to collection of electrical impedence data by ROBOCAT II and prior to analysis on the FACSCalibur. The ROBOCATII was run with rinse buffer instead of Alcalyse solution.
o We looked at ROBOCAT II results from both a combination of PBMC and PMN cells as well as either PBMC or PMN cells alone. From this analysis we decided that changes within separate populations of cells (PBMC or PMN cells) were easier to identify when looking at pure populations of cells rather than a mixture of PBMC and PMN cells.
o We determined the concentration of each cell type to use in order to generate robust peaks on the ROBOCAT II machine as well as provide sample for FACSCalibur flow cytometry and CytoViva microscopy analyses. This concentration was 2 x 10⁶ cells/ml for PBMC and 3 x 10⁶/ml for PMN cells. Similar to the Alcat Test whole blood set up, 100 ul of cells were added per well. ROBOCAT II, FACSCalibur and CytoViva analyses were performed on sample from the same well in parallel.
• Comparisons between ROBOCAT II and FACSCalibur were first performed with normal blood samples that were not exposed to Alcat Test antigen cassettes. Finding a donor that gives a repeated, uniform response to exposure of blood to a specific antigen could be difficult and reactivity may vary between blood samples drawn on different days. Instead, normal purified white blood cells were exposed to different doses of the bacterial peptide f-MLP, a classical PMN activation stimuli that trigger ROS formation and degranulation. This allowed us to obtain reproducible and concentration-dependent neutrophil activation and the resulting cellular changes were analyzed simultaneously by both ROBOCAT II and FACSCalibur.
o An increase in PMN cell size was detected by both ROBOCAT II and
FACSCalibur.
• The decision to fix or not to fix cells for analysis by flow cytometry was determined empirically. Unfixed and fixed samples were run side by side and data compared.
o We determined that fixing of cells results in cell shrinkage, making it harder to distinguish changes in size of cells resulting from exposure to antigens. All data in this report was generated from cells that were unfixed.
• All samples analyzed by ROCOCAT II and FACSCalibur were also examined by CytoViva microscopy.
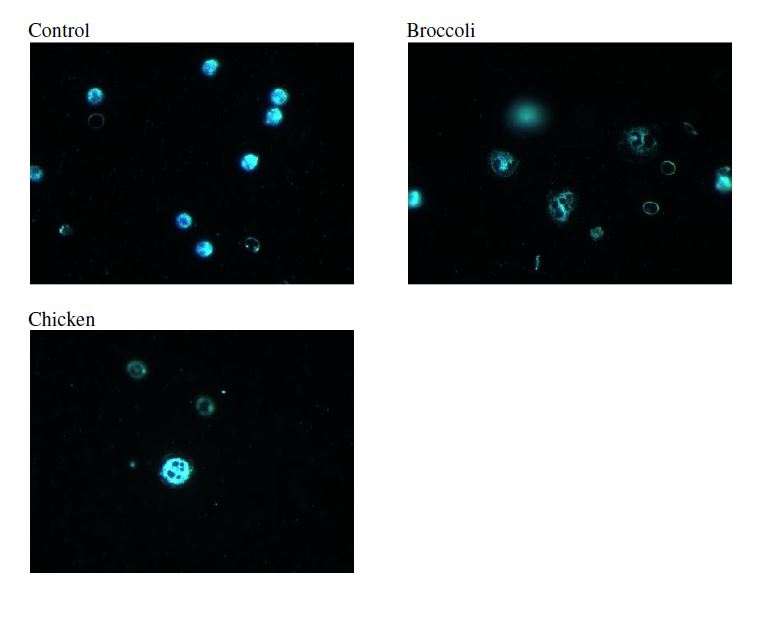
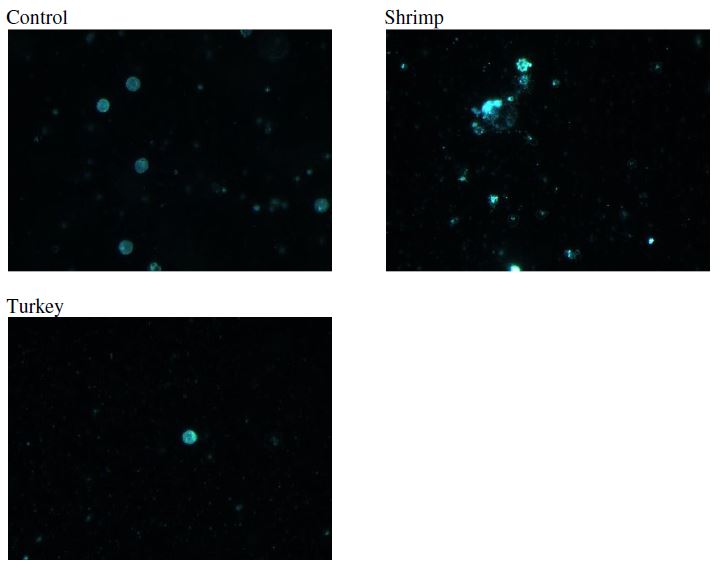
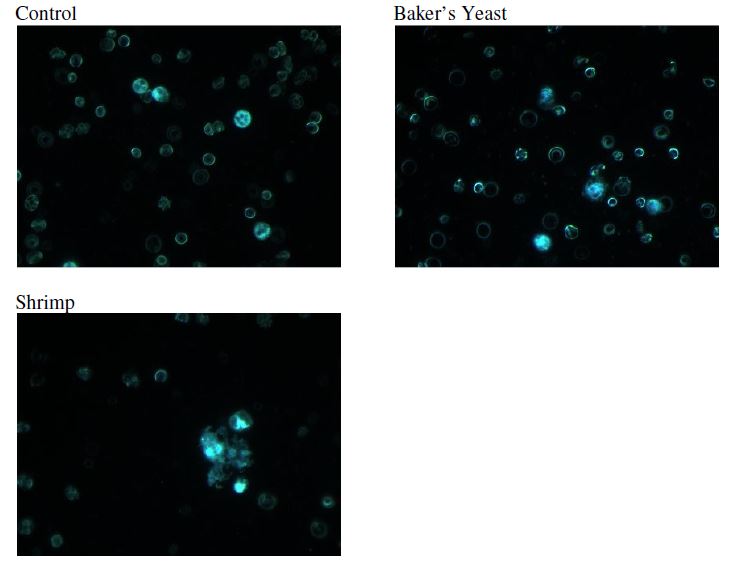
o Interesting cellular changes were observed on an individual cell basis that could not be obtained by either ROBOCAT II or FACSCalibur analyses. While cells responded similarly to individual treatments (specific antigen), very detailed changes could be seen in the microscope that included the flattening of cells, increases/decreases in size, rapid movement of granules within PMN cells, expulsion of granules from PMN cells and also adherence properties of cells that were reflected in the number of cells visible in a microscopy field. When it was hard to find cells on the slide, this indicated that cells had most likely either disintegrated or adhered to the Alcat Test a plate or the plastic tube that was used to store the cells prior to the preparation of slides for microscopy.
Outline of the performed work:
• Prepared purified white blood cells that had not been exposed to antigen.
o Ran cells on both ROBOCAT II and FACSCalibur to compare size profiles.
o Ran both a mixture as well as the PMN and PBMC cell fractions separately on ROBOCAT II to familiarize ourselves to their different size profiles on this machine.
o Compared the profile of white blood cells in the starting sample (whole blood) to the purified white blood cells on both the ROBOCAT II and FACSCalibur.
These initial tests allowed us to detect any possible adverse effects on white blood cells due to the purification method and begin to develop an understanding of how to compare data between the two machines.
• Treated purified white blood cells with serial dilutions of f-MLP.
o Analyzed samples on ROBOCAT II and FACSCalibur.
o Tested effects of fixation on the cellular characteristics (forward scatter and side scatter) obtained from analysis of cells on FACSCalibur.
Secondary goal: To validate cellular changes in the allergy panel by flow cytometry.
We previously identified 3 people with some known food sensitivities. These 3 individuals went through a second set of blood draws and testing, where a detailed comparison between the ROBOCAT II and FACSCalibur was performed in parallel. Testing used purified white blood cells, reconstituted in autologous plasma, and then applied to allergen plates.
In brief:
• Allergen plate testing was performed on 3 blood donors, each on a separate day. On each test day 20 ml of whole blood was drawn from a single donor into 4 heparinized blood collection vials. 5 ml of whole blood was added to 20 ml of Alcat Test diluent and the remaining 15 ml of whole blood separated on a histopaque gradient to isolate PBMC and PMN cell fractions. The serum was stored at 4oC for later reconstitution of PBMC and PMN cells in 10% serum. PBMC and PMN cells were washed 3 times with PBS and stored in phosphate buffered saline until further use.
• A 15 well whole blood control plate was then run to ascertain proper functioning of the ROBOCAT II machine. Next, whole blood in diluent from the donor was added to a 55-well Alcat Test a antigen plate and following a total of 45 minutes of incubation with gentle agitation (15 min. initially at 37oC followed by 30 min. at room temperature) the plate was loaded onto the ROBOCAT II machine and data collected.
• Analysis of the antigen testing of whole blood was then used to determine which antigen wells to expose the purified PBMC or PMN cells to for the more involved comparison between the ROBOCAT II and FACSCalibur machines. Four to five of the most positive results from the whole blood testing of the entire Alcat Test a antigen plate were then chosen as antigens for further analysis of PBMC and PMN cells. Separate Alcat Test a antigen plates were processed for PBMC and PMN cells.
• Following incubation of 100 ul of either PBMC or PMN cells per well in 10% serum at 2 x 10⁶ cells/ml and 3 x 10⁶/ml, respectively, aliquots of cells were removed to either FACS tubes for collection of flow cytometry data or to polypropylene tubes for preparation of microscope slides and microscopy on the CytoViva microscope.
• For each donor, we did detailed comparison between ROBOCAT II data and FACS data for a) 3 test wells without allergens (negative controls), and b) the 4 to 5 test wells for each person that showed the most positive results (i.e. the most indicative of an allergic reaction).
We initially focused on the following 2 parameters:
1. Particle size: Evaluate the correlation of ROBOCAT II measurement of the distribution of particle sizes to FACSCalibur’s forward scatter measurements, which are also equated to particle sizes.
2. Degranulation: Perform cell subset analysis using the FACSCalibur’s ability to measure cellular granularity, to evaluate degranulation of granulocytes.
Methodological details for Protocol 1:
1: Particle size
Cellular size distribution can be correlated to cell viability and function. Apoptotic characteristics comprise a series of biochemical events that lead to cell morphology changes and death. Apoptotic morphological changes consist of cell shrinkage and blebbing (expulsion of smaller particles from the core cellular body). Necrosis is a sudden, unnatural process, and is an irreversible cell death in which the cell will swell before disintegrating.
As part of this protocol, a detailed comparison between the ROBOCAT II particle size distribution and the FACSCalibur measurements was performed. Parallel test wells where no changes were seen, versus wells where the ROBOCAT II was measuring changes in particle size, were compared.
Initial work was done with white blood cells that had not been exposed to antigen but that were treated with the bacterial peptide f-MLP. This treatment results in reproducible activation of neutrophils that is dose dependent. The resultant cellular alterations that included size change were measured by both ROBOCAT II and FACSCalibur.
2: Degranulation
When an allergic response is triggered in a test well, and measured by ROBOCAT II, even minute cellular size changes may represent major functional changes. For example, the granulocytes may de-granulate during formation of Reactive Oxygen Species (ROS). This may only result in a minor change in cell size, but will show up clearly on the side scatter measurements on the FACSCalibur machine, where side scatter is a result of cellular granularity. A detailed comparison of ROBOCAT II and FACSCalibur data will help evaluate this, and look for patterns, such as evaluate whether all test wells that score positive by ROBOCAT II analysis, will also always show de-granulation by FACS.
A positive control for this process is treatment of PMN cells with f-MLP. We investigated this in our preliminary experiments in order to work out conditions for sample preparation and how best to document and compare data from the two machines.
Standard “PeakFlow” 6 micrometer beads were used as controls to ensure consistent machine performance between runs.
Results
1a. Comparison of cell profiles between ROBOCAT II and FACSCalibur
ROBOCAT II
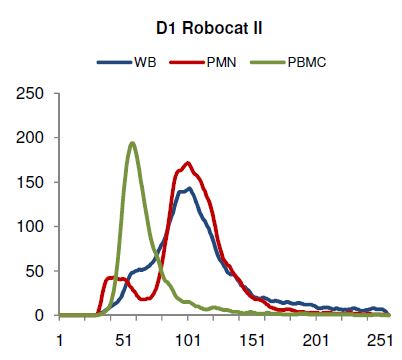
In the figure below, a comparison is made between ROBOCAT II data generated from untreated (no antigen) whole blood, PBMC and PMN cells from donor 1 (D1). Since PMN cells make up about 70% of white blood cells in whole blood, this is the major peak that can be seen in the whole blood sample (dark blue line in figure below). The overlay of PBMC and PMN cells on top of the whole blood ROBOCAT II data shows that separation of white blood cell fractions on the histopaque gradient did not affect the overall PBMC or PMN cell profiles. The appearance of a small peak of PMN cells that is slightly smaller in size than the PBMC peak indicates that approximately 10% of the PMN cells showed shrinkage, likely due to handling and centrifugation involved in the isolation process.
FACSCalibur flow cytometry
Definition of Terminology
FSC = forward scatter = cell size
SSC = side scatter = granularity
The figure below shows results of whole blood run on the FACSCalibur machine. It is clear that individual populations of cells cannot be identified in whole blood.
A very different picture emerges when separate PBMC and PMN cell fractions are analyzed (see following two figures).
In the figure below, the FSC/SSC plot of PBMCs is shown. The circled areas indicate discrete populations of cells. The black circle indicates the smallest types of particles that include debris, dead cells and cell fragments as well as red blood cells. The blue circle indicates the region on the graph where apoptotic cells are. The red circle indicates the lymphocyte population of cells that includes B and T lymphocytes, natural killer cells and stem cells. The green circle indicates the monocyte population. There is some overlap between the different populations. The circles illustrate the complexity that can be revealed when a second dimension (granularity) is combined with size analysis (FSC).
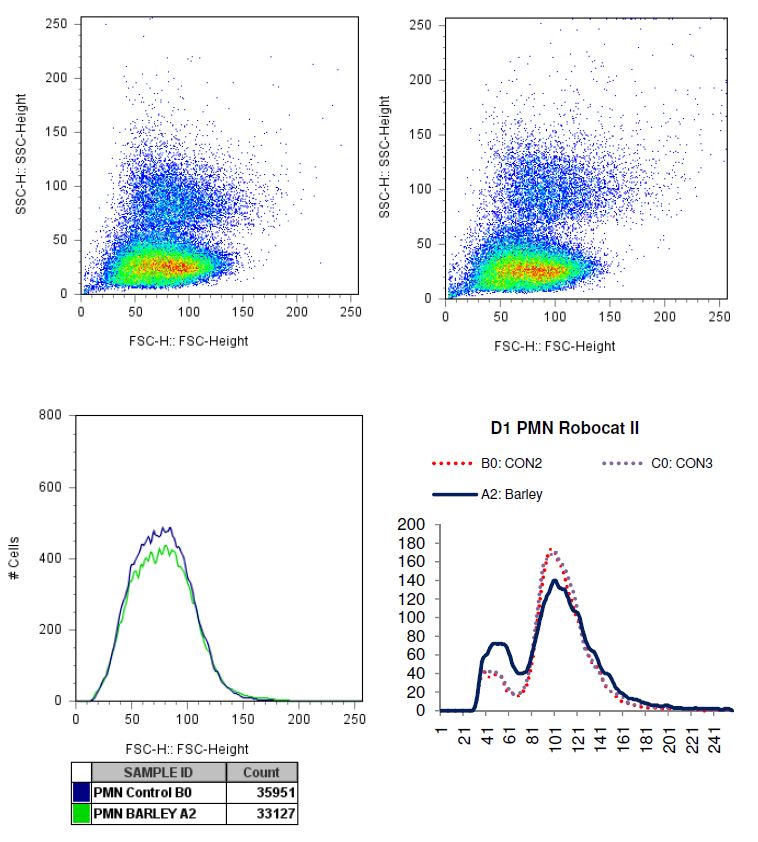
The red arrow is an example of a typical shift in lymphocytes that occurs when lymphocytes become apoptotic. Cells originating from the lymphocyte population (red circle) become smaller and more granular due to membrane blebbing and other cellular changes (which is seen by the flow cytometer as an increase in SSC) and now are found in the area of the blue circle. The first sample in appendix A demonstrates this phenomenon following exposure of PBMC from donor 1 to the barley antigen.
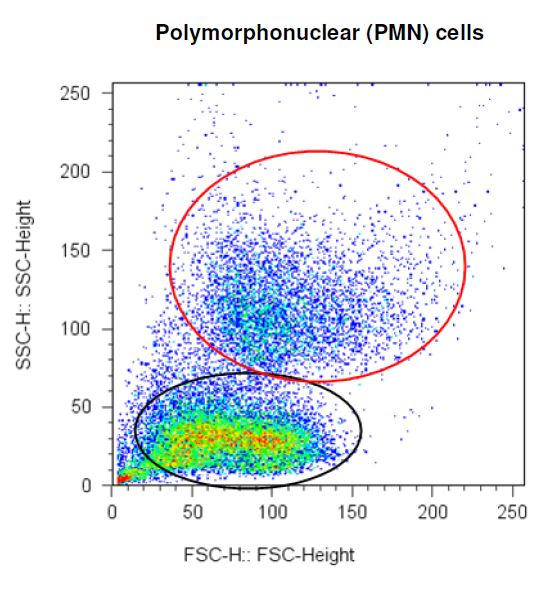
In the figure below, the FSC/SSC plot of PMN cells is shown. PMN cells are a heterogeneous population of cells and this is reflected in the complex FSC/SSC pattern generated from the wide range of “states” of PMN cells. PMN cells are very reactive cells that contain large numbers of granules and have a propensity to degranulate and also alter their size based on adherence and activity (for example ROS generation).
It can be seen that the cells in the red circle that contain granules (high SSC) are also the largest cells. Cells in the black circle have degranulated (low SSC) and are also decreased in size. However, on a single-parameter histogram on particle size, the two populations are highly overlapping.
Conclusions:
• PBMC and PMN cell profiles on ROBOCAT II are similar to results obtained with whole blood.
• The separate analysis of PBMC and PMN cells on FACSCalibur allows individual populations of cells to be identified and changes in size analyzed.
1b. Treatment of PBMC and PMN cells with f-MLP
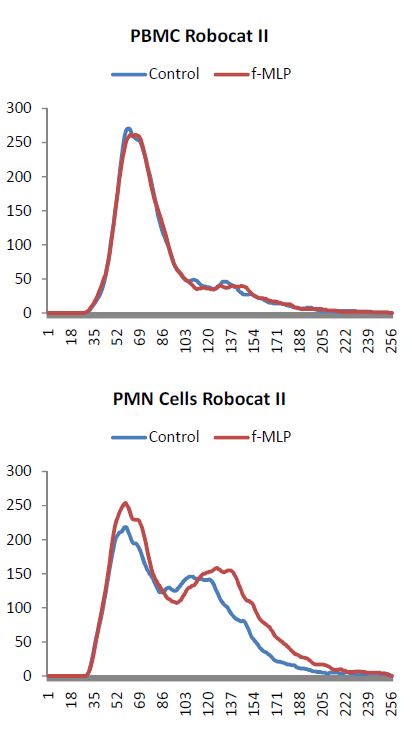
ROBOCAT II results of PBMC and PMN cells treated with the bacterial peptide f-Met-Leu-Phe (f-MLP) to trigger antibacterial defense behavior among monocytes (in the PBMC population) and PMN cells.
For PBMC, we could expect to see some changes in the monocyte population (right hand peak). However, no major changes were seen.
For PMN cells, we would expect f-MLP to induce changes. In the second figure below, treatment of PMN cells with f-MLP shows a clear increase in cell size of the right hand peak. An increase in number of particles in the left hand peak can also be seen. This indicates that both swelling and degranulation was happening.
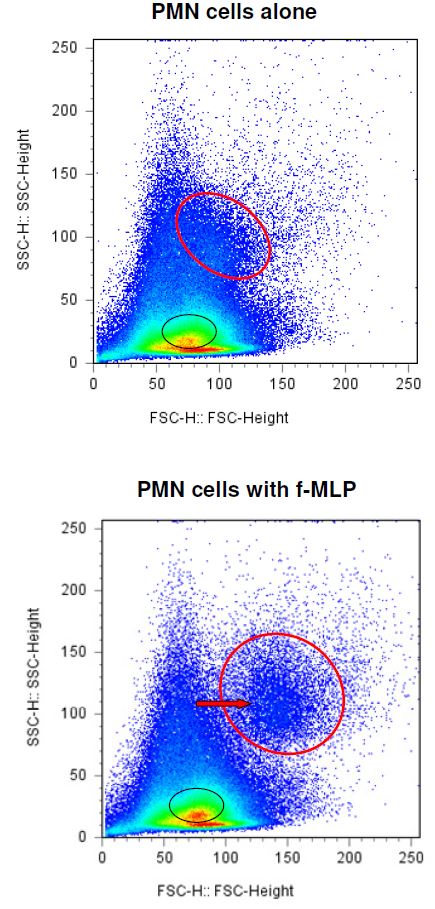
FACSCalibur results of PMN cells treated with f-MLP. A shift is seen towards increased FSC by cells from the high SSC population. This shift is illustrated by the red circles below, where cells originating in the circle in the first figure follow the arrow into the circle in the second figure after exposure to f-MLP. A shift is also seen in a different subpopulation of PMN cells indicated by a black circle in the figure below. These figures are dot plots that use color to indicate the density of cells (red being the most dense). Following treatment of PMN cells with f-MLP there is an increase in PMN cells in this area of the figure.
Conclusions:
• Treatment of PBMC with f-MLP did not result in any major changes in cell size.
• Treatment of PMN cells with f-MLP resulted in an increase in cell size that is detected by both ROBOCAT II and FACSCalibur.
• This increase in PMN cell size following exposure to f-MLP can clearly be seen in a subset of PMN cells when analyzed by flow cytometry. The high SSC population observed in the FSC/SSC figures above contain cells that contribute to the 2nd (larger) peak seen by ROBOCAT II.
2. Exposure of PBMC and PMN cells from 3 donors to ALCATa antigens and comparison between ROBOCAT II and FACSCalibur data.
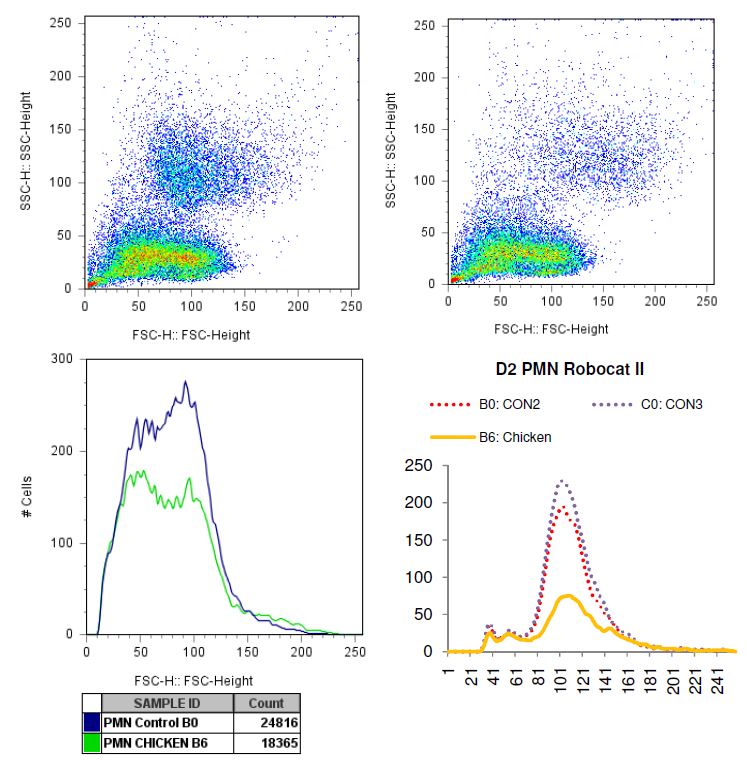
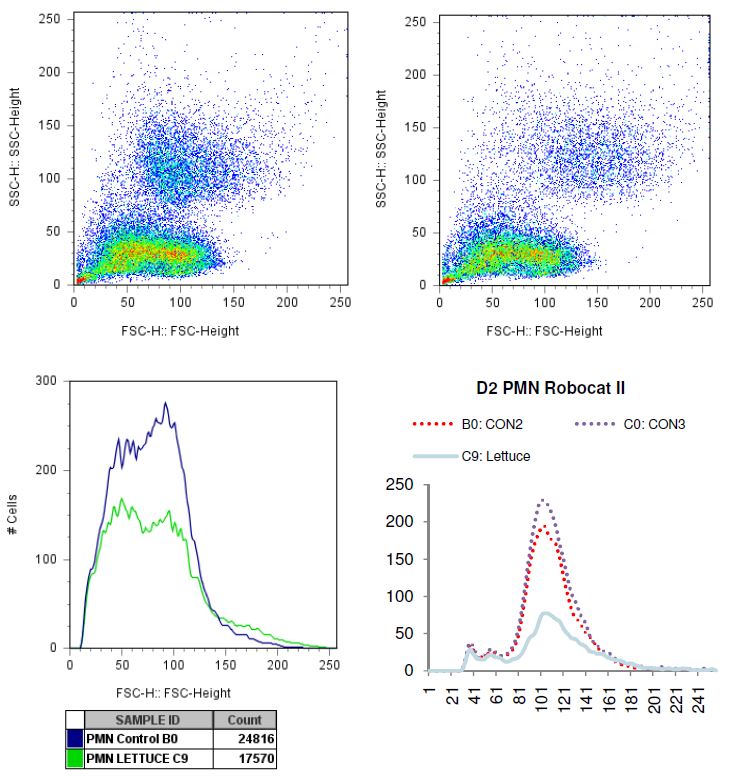
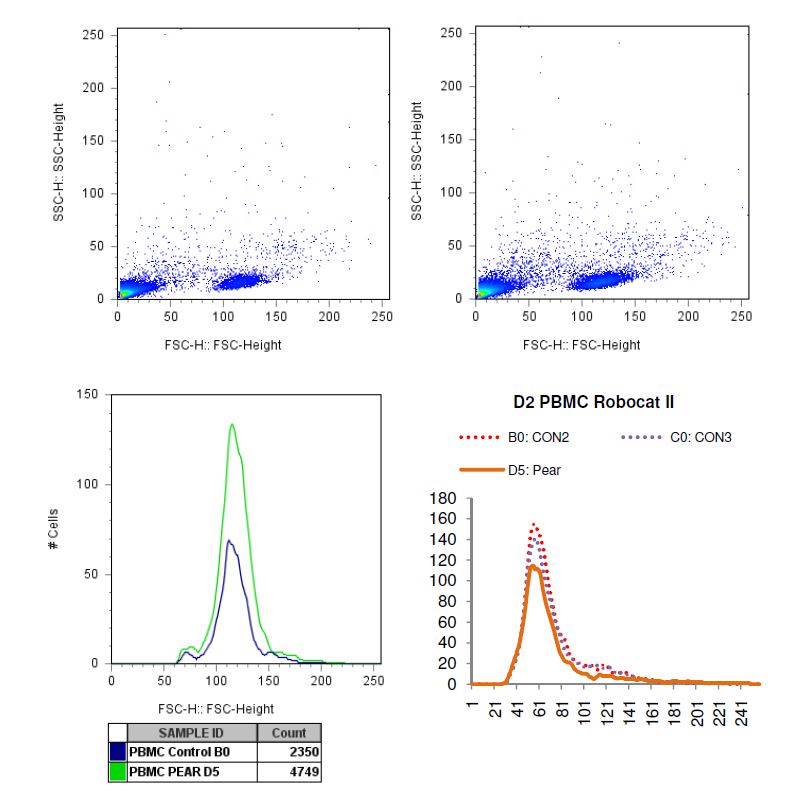
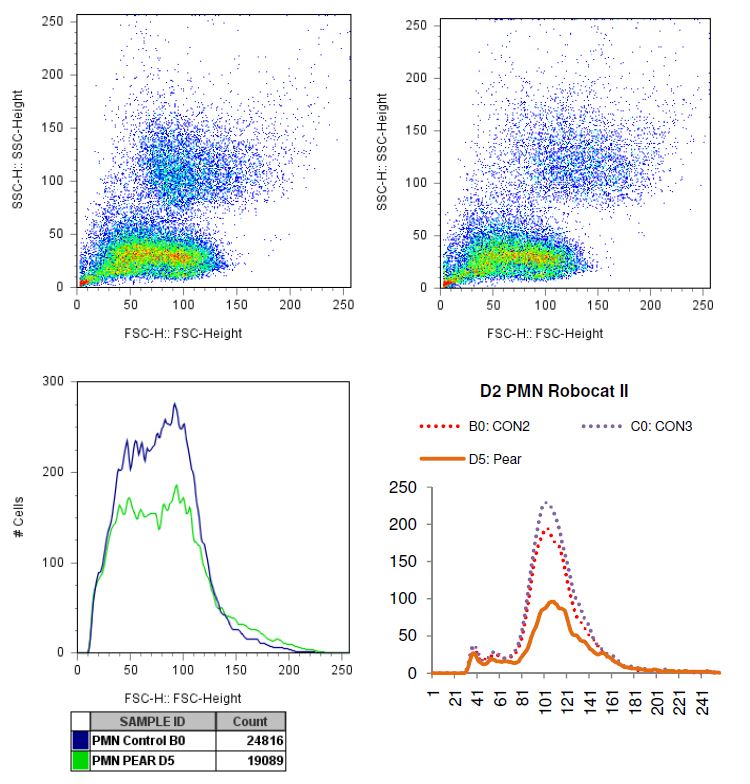
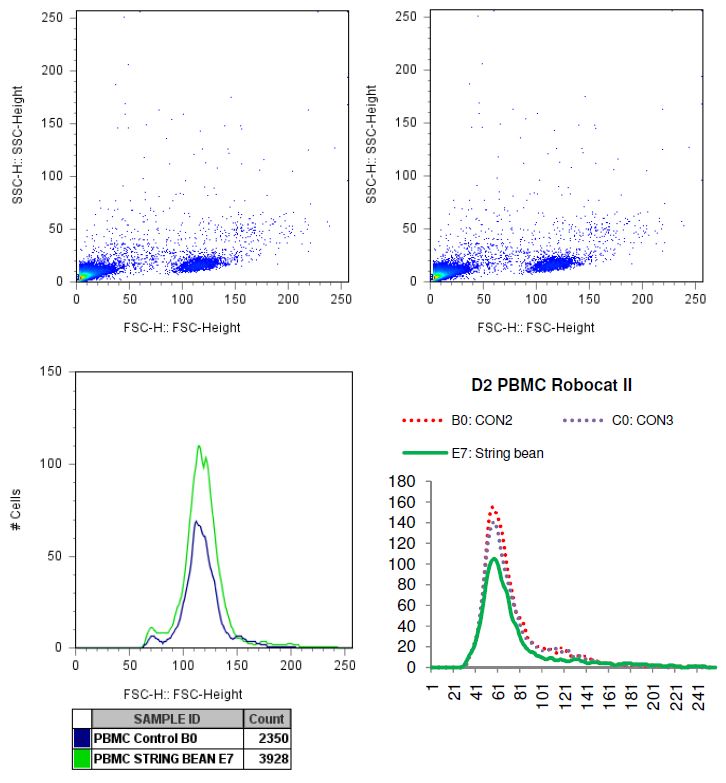
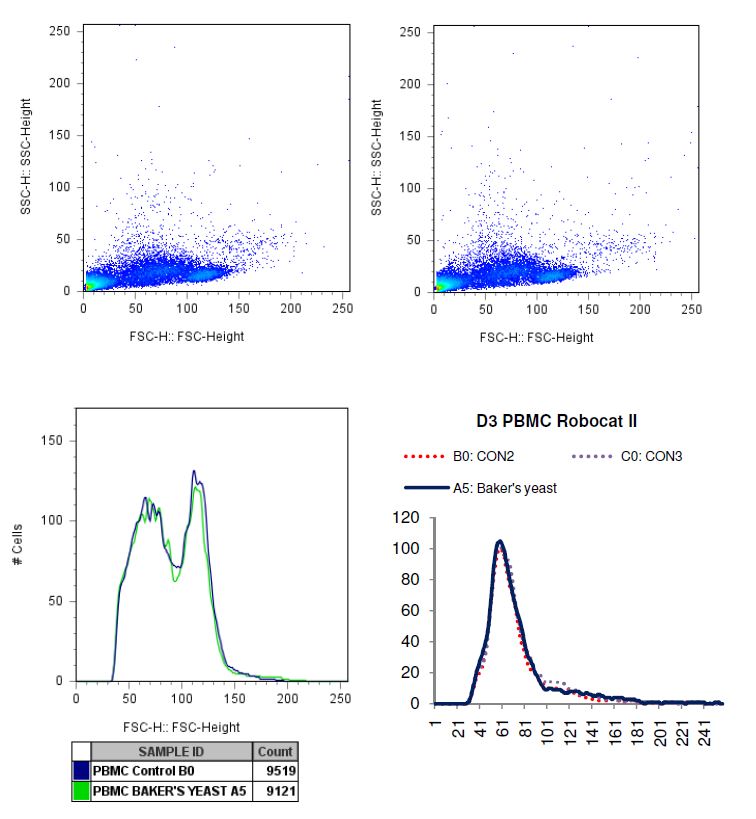
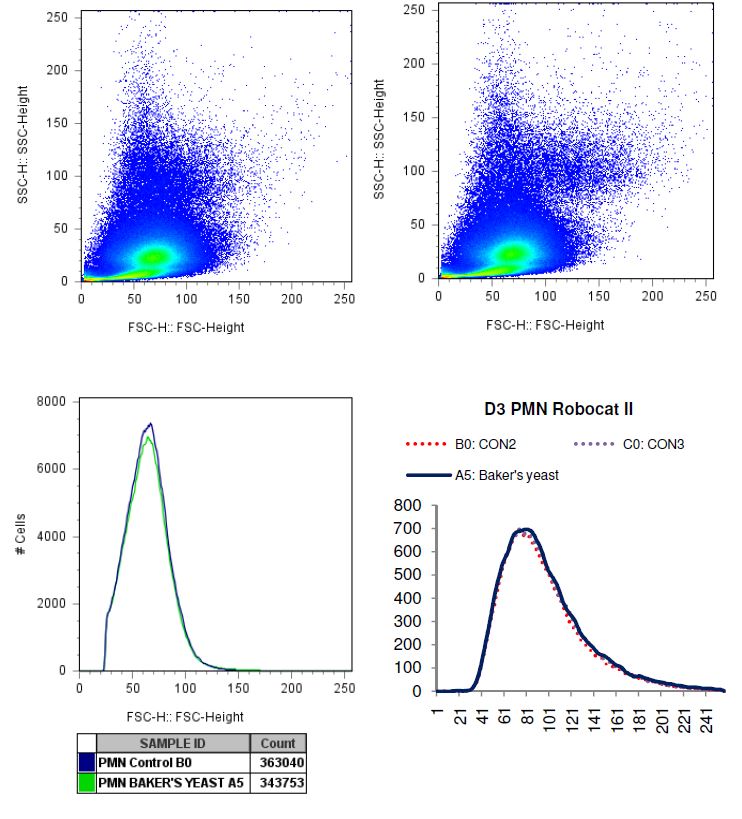
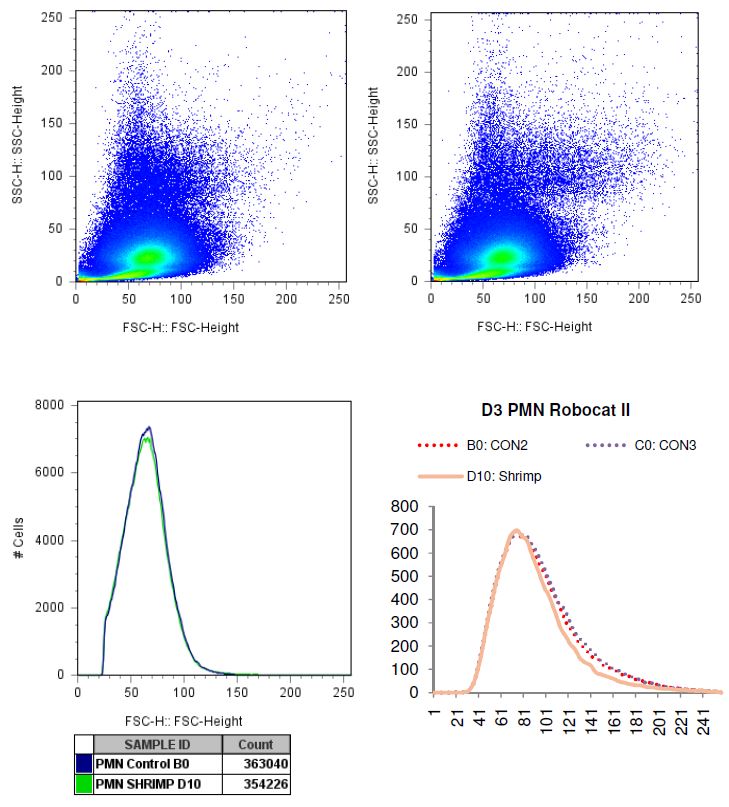
Results from the comparison of ROBOCAT II and FACSCalibur data from PBMC or PMN cells exposed to antigens is summarized in the table on the following page.
The raw data for each donor and results of antigen exposure follow at the end of this report in Appendix A. CytoViva microscopy photographs follow in Appendix B.
Please refer to overview table on the following page.
The “?” indicates this value was higher than the control and the “?” indicates this value was lower than the control.
Looking for correlations: The two far right columns indicate whether there was a correlation between the two machines for PBMC (A) and PMN cell (B) data. A green “+” indicates correlation and a black “-” indicates that different results were obtained by the two machines.
* Note: For Donor 3, the presence of red blood cells in the PMN fraction resulted in obscuring the lower PMN peak (Peak 1). The presence of red blood cells is also reflected in the large Peak Height of PMN Peak 2.
Conclusions
ROBOCAT II data:
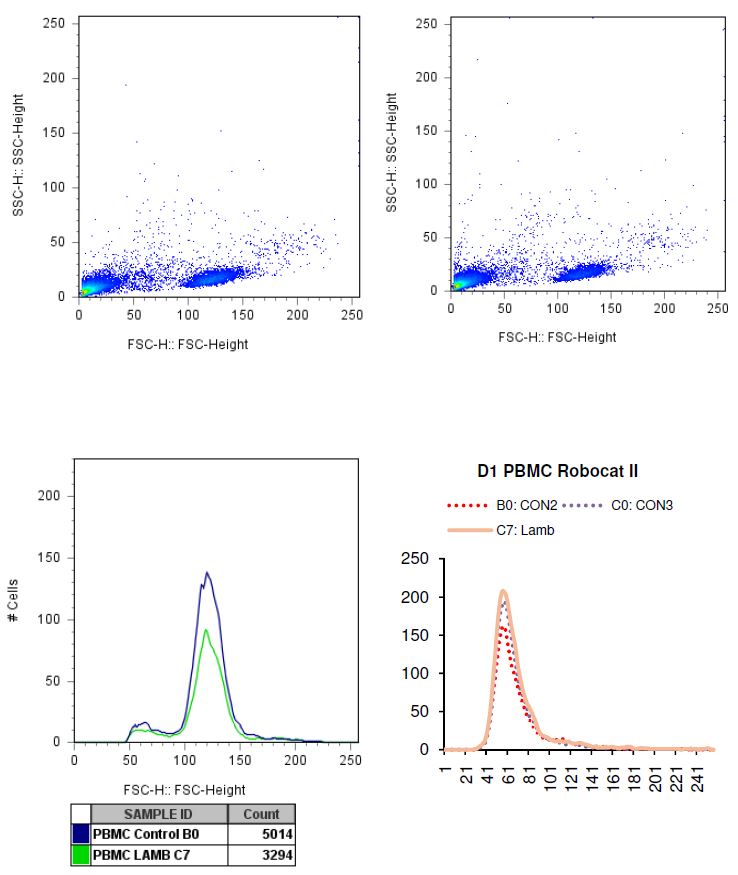
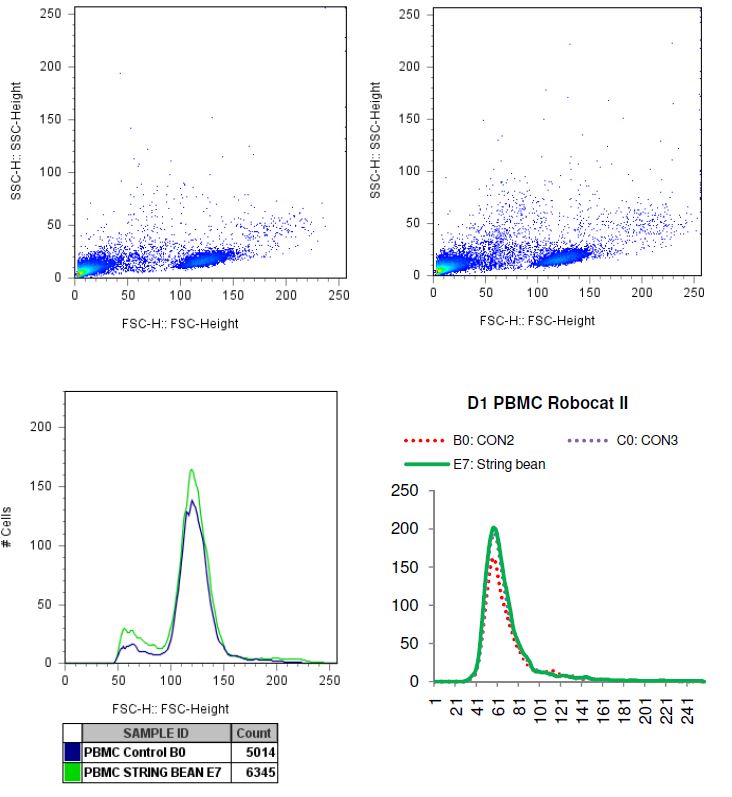
• PBMC peak height varies more than peak position, following exposure to allergen.
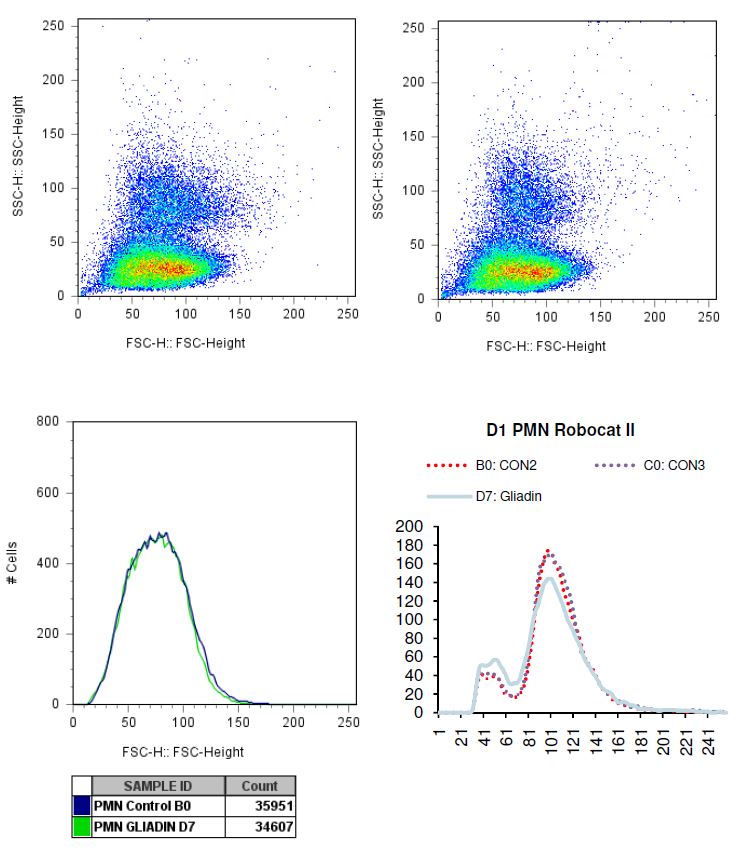
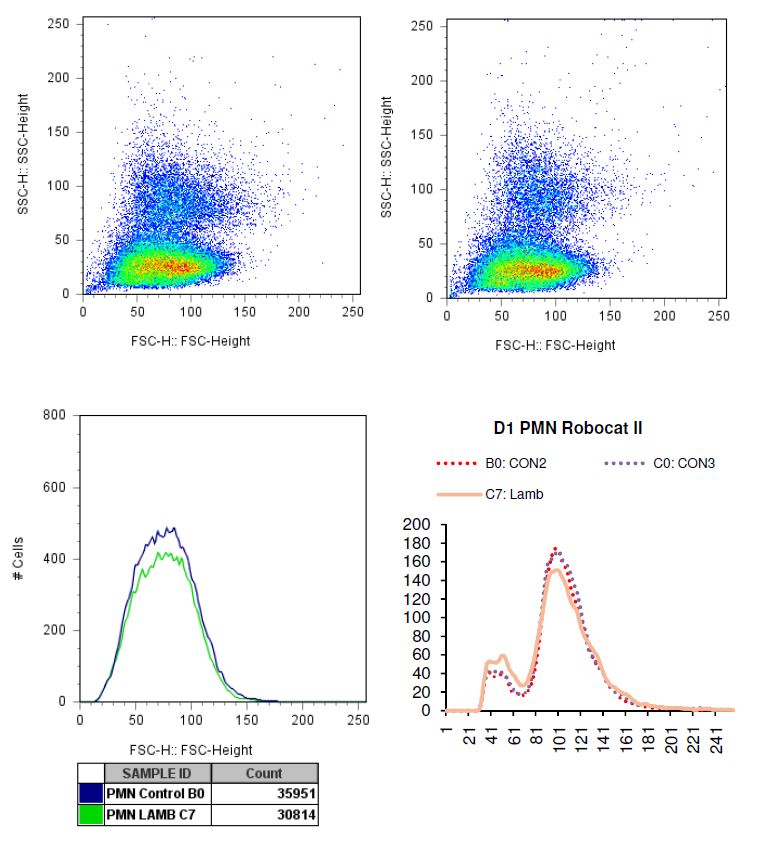
• For donors 1 and 2, two PMN cell peaks can be seen by ROBOCAT II. These peaks vary more in peak height than peak position following exposure to allergen.
FACSCalibur data:
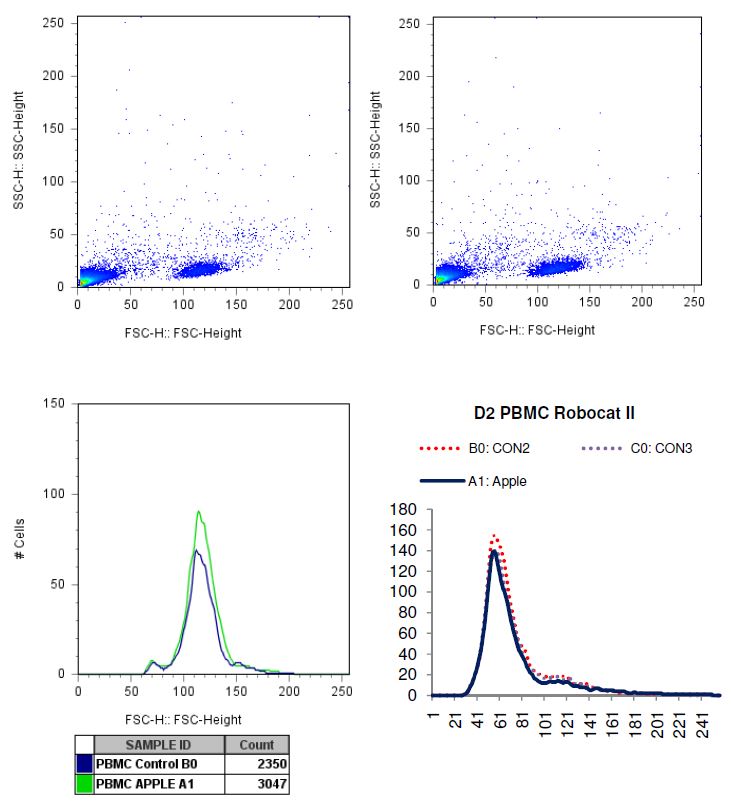
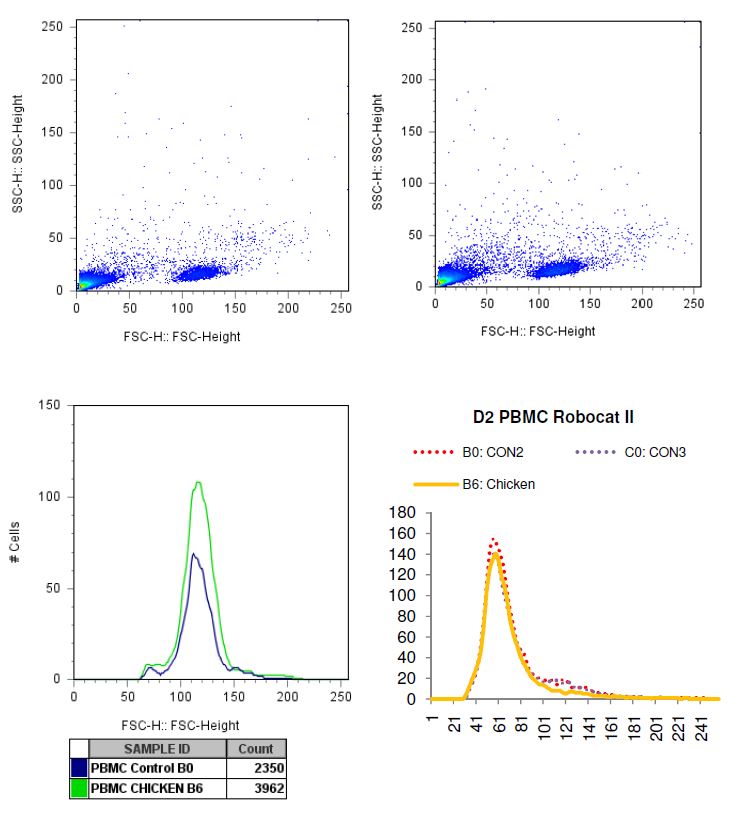
• Monocytes within the PBMC is a cell population that is easy to identify on a FSC/SSC plot from FACSCalibur. Gating on these cells and determining changes in the mean FSC (size) showed increases in cell size (FSC) following exposure to allergen.
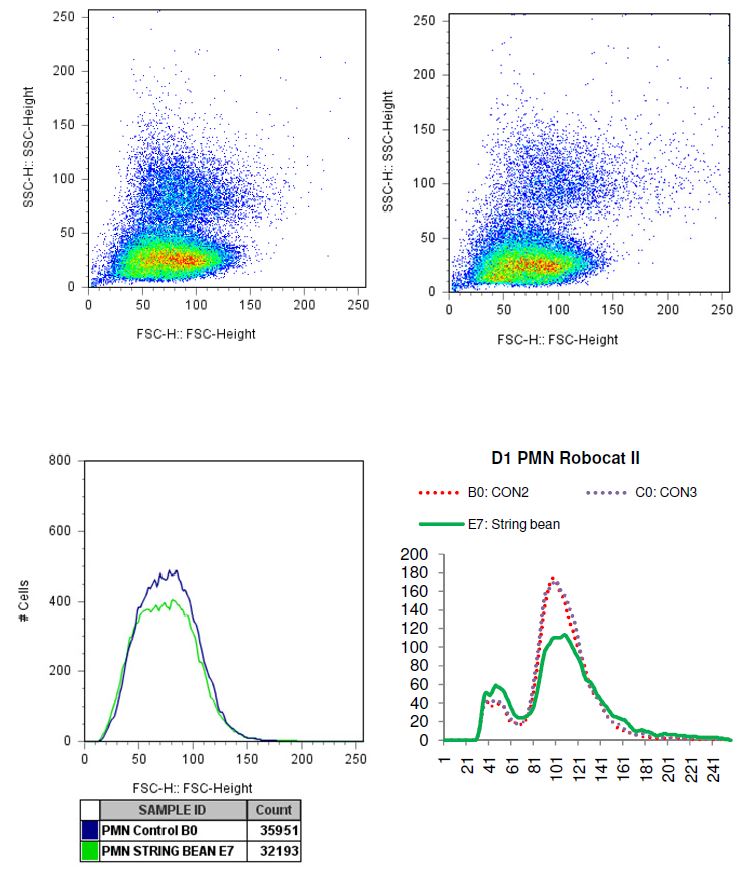
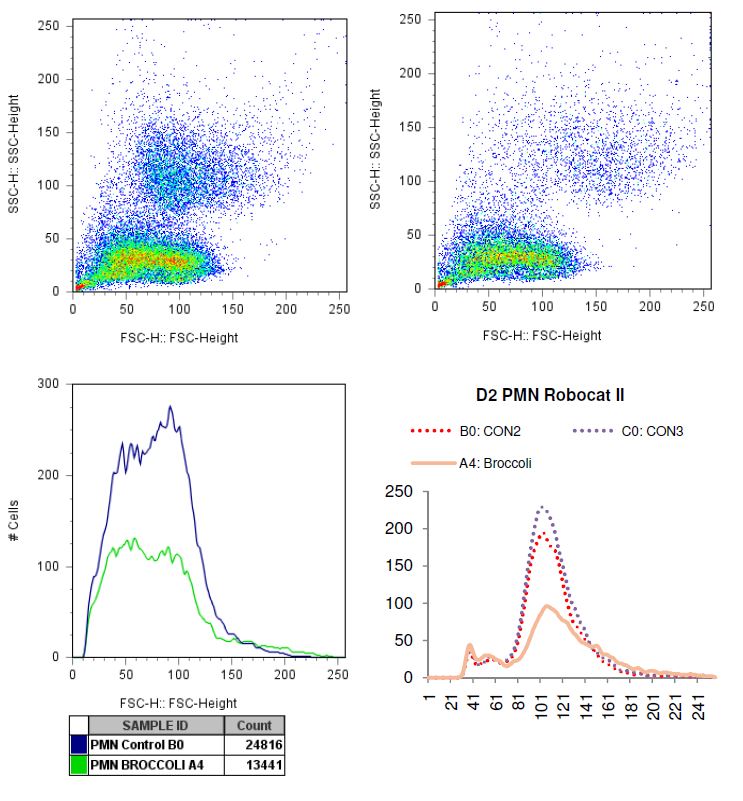
• PMN cells can be separated into different populations based on side scatter (SSC), a measure of granularity. The mean FSC of the high SSC PMN cells show increases for donors 2 and 3 following exposure to allergens and show both increases (barley, string bean) and decreases (fructose, gliadin, lamb) for donor 1.
• Very little change in FSC is seen for low SSC PMN cells following exposure to allergens. This probably reflects the diversity of this large population of PMN cells. Some cells in this population may be increasing in FSC while others are decreasing, resulting in a mean FSC that is unchanged.
Comparison between ROBOCAT II and FACSCalibur data:
• Since PMN cells make up the majority of white blood cells present in whole blood, PMN analysis on ROBOCAT II more closely approximates what is seen with whole blood antigen testing than PBMC analysis.
• Donor specific differences were seen. This is well illustrated by donor 3 where PBMC show 2 peaks by FACSCalibur analysis and only one by ROBOCAT II. Also, PMN cells from donor 3 produced a single large peak on the ROBOCAT II while PMN cells from donors 1 and 2 produced 2 peaks.
• FACSCalibur analysis gives a more complex picture of the effect of allergen exposure of PBMC and PMN cells and allows changes in size to be assessed on specific cell subpopulations.
• Overall, there was good correlation between changes in size detected by ROBOCAT II following antigen exposure and changes detected by FACSCalibur. When differences did occur, they point to the complexity of cellular changes occurring within different sub-populations of cells that cannot always be teased out when assessing the overall change in size of all cells analyzed as a single group.
Overall accomplishments
The main objective of this initial phase of the study was to be able to control sample handling to allow the best correlation between ROBOCAT II and flow cytometry. This had to be controlled before we can continue more complex testing of cell phenotype, viability/death, ROS formation, and other functions. Initial work focused on determining if the same changes in particle size when cells react with f-MLP showed similarities between ROBOCAT II and FACSCalibur.
The strength of ROBOCAT II and FACSCalibur analysis is the ability to look at large numbers of cells and to quantify results. This ability is taken further with the FACSCalibur because the addition of the parameter of side scatter (granularity) along with size allows the differentiation of distinct populations of cells that can be separately analyzed for changes in size following exposure to antigens.
Analysis of antigen exposed samples with CytoViva microscopy yielded additional information that was not possible to get from either the ROBOCAT II or FACSCalibur machines. The strength of the CytoViva data is a detailed picture of cellular changes on a per cell basis. Changes in cell size, shape and cellular contents (ex. very active granules vs. loss of granules) can visibly be seen. See also Appendix B at the end of this report.
Future work
Now that a direct comparison between particle measurements by ROBOCAT II and FACS has been completed, we are ready to engage in further study, including more complex measurements and comparisons, including ROS formation and cell viability/death, with particular attention on oxidative burst and apoptosis.
In parallel, we will initiate discussions and protocol development for how to establish methods for long-term blood cultures and testing of nutrients and supplements.
The testing and optimization of long-term cultures will involve testing of cell proliferation, expression of activation antigens, as well as detailed measure of different types of cell death, in the absence versus presence of various nutrients and immune supportive natural products.
Appendix A
Donor 1 PBMC
Barley
FACSCalibur data
Donor 1 PMN
Barley
FACSCalibur
Donor 1 PBMC
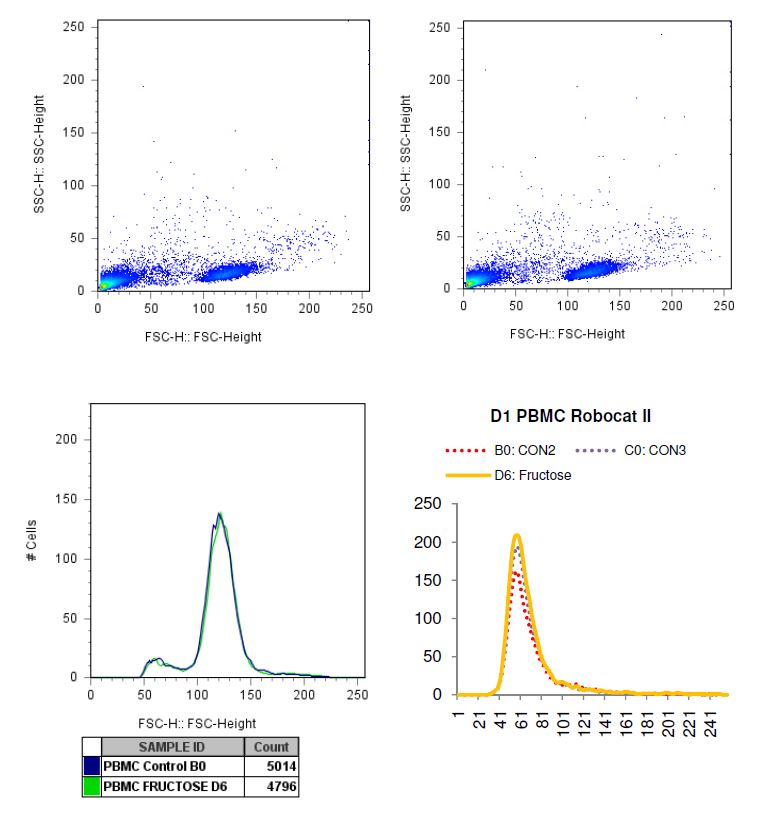
Fructose
FACSCalibur
Donor 1 PMN
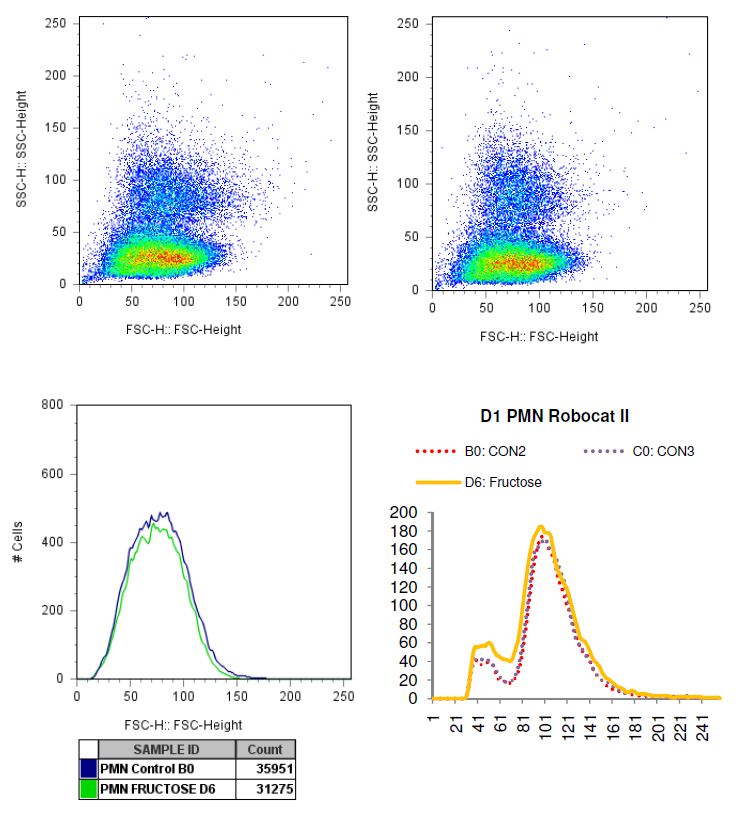
Fructose
FACSCalibur
Donor 1 PBMC
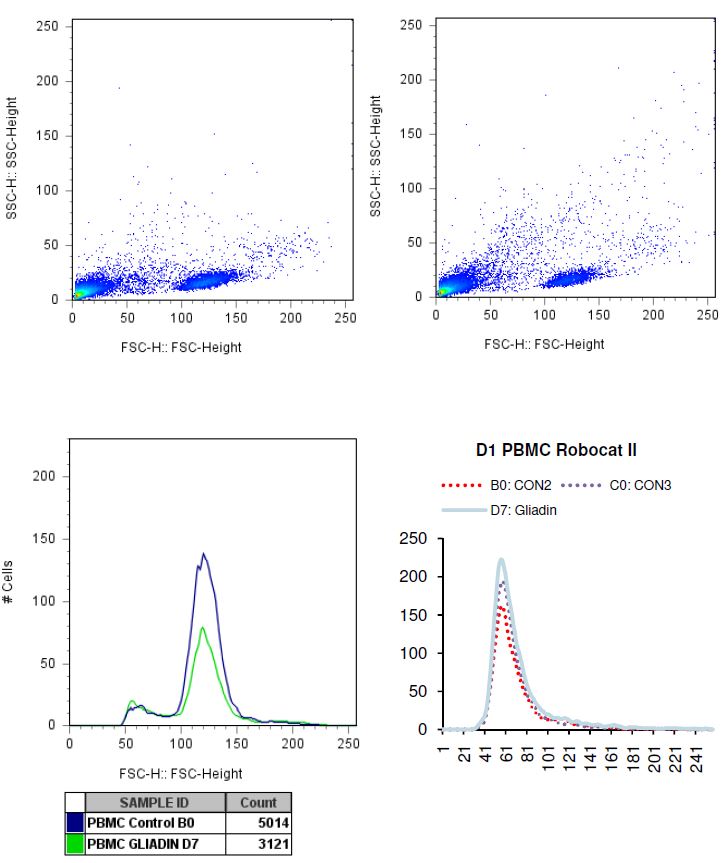
Gliadin
FACSCalibur
Donor 1 PMN
Gliadin
FACSCalibur
Donor 1 PBMC
Lamb
FACSCalibur
Donor 1 PMN
Lamb
FACSCalibur
Donor 1 PBMC
String bean
FACSCalibur
Donor 1 PMN
String bean
FACSCalibur
Donor 2 PBMC
Apple
FACSCalibur
Donor 2 PMN
Apple
FACSCalibur
Donor 2 PBMC
Broccoli
FACSCalibur
Donor 2 PMN
Broccoli
FACSCalibur
Donor 2 PBMC
Chicken
FACSCalibur
Donor 2 PMN
Chicken
FACSCalibur
Donor 2 PBMC
Lettuce
FACSCalibur
Donor 2 PMN
Lettuce
FACSCalibur
Donor 2 PBMC
Pear
FACSCalibur
Donor 2 PMN
Pear
FACSCalibur
Donor 2 PBMC
String bean
FACSCalibur
Donor 2 PMN
String bean
FACSCalibur
Donor 3 PBMC
Baker’s yeast
FACSCalibur
Donor 3 PMN
Baker’s yeast
FACSCalibur
Donor 3 PBMC
Shrimp
FACSCalibur
Donor 3 PMN
Shrimp
FACSCalibur
Donor 3 PBMC
Strawberry
FACSCalibur
Donor 3 PMN
Strawberry
FACSCalibur
Donor 3 PBMC
Turkey
FACSCalibur
Donor 3 PMN
Turkey
FACSCalibur
Appendix B
Donor 1 PBMC
Donor 1 PMN
Donor 2 PBMC
Donor 2 PMN
Donor 3 PBMC
Donor 3 PMN


